如何向ggpairs()添加外部图例?

13

我正在使用 ggpairs 绘制散点图矩阵。 我正在使用以下代码:

# Load required packages
require(GGally)

# Load datasets
data(state)
df <- data.frame(state.x77,
                 State = state.name,
                 Abbrev = state.abb,
                 Region = state.region,
                 Division = state.division
) 
# Create scatterplot matrix
p <- ggpairs(df, 
             # Columns to include in the matrix
             columns = c(3,5,6,7),

             # What to include above diagonal
             # list(continuous = "points") to mirror
             # "blank" to turn off
             upper = "blank",
             legends=T,

             # What to include below diagonal
             lower = list(continuous = "points"),

             # What to include in the diagonal
             diag = list(continuous = "density"),

             # How to label inner plots
             # internal, none, show
             axisLabels = "none",

             # Other aes() parameters
             colour = "Region",
             title = "State Scatterplot Matrix"
) 

# Show the plot
print(p)

然后我得到了以下的图表:

enter image description here

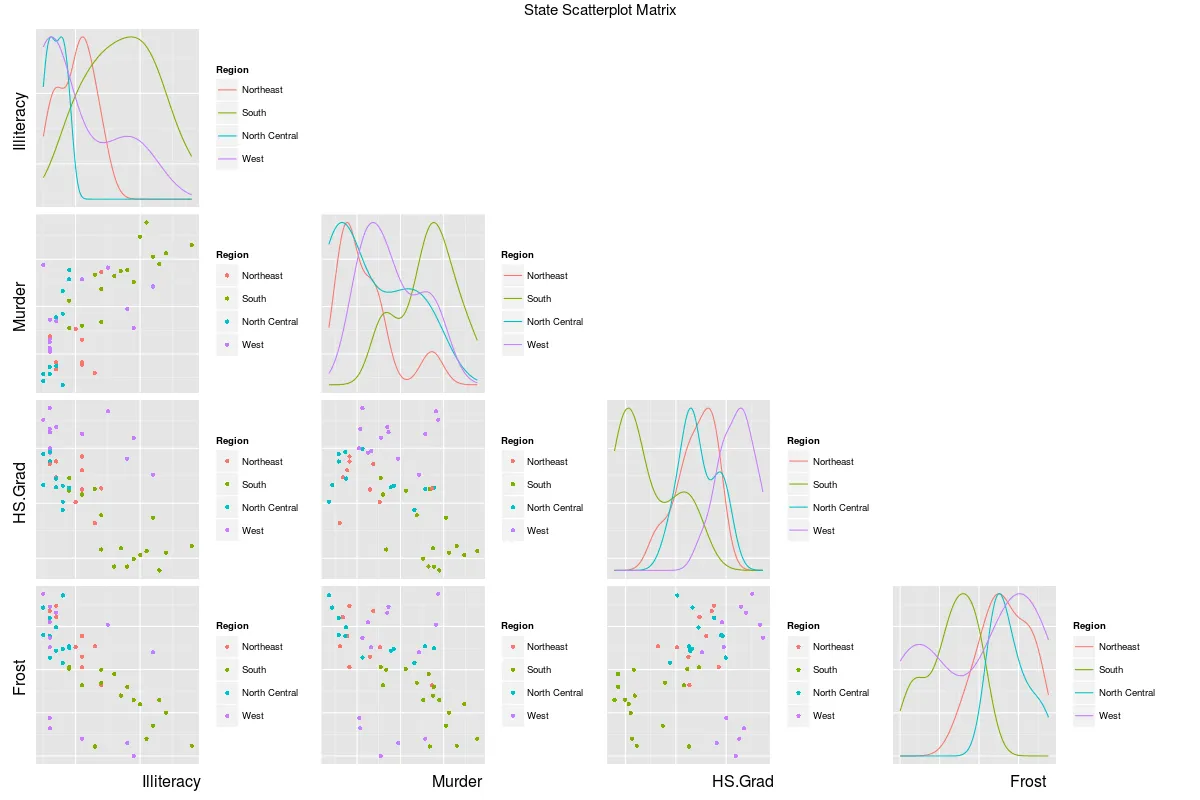
现在,很容易看出我在矩阵中为每个图表都获得了图例。我希望为整个图表只有一个通用的图例。我该怎么做? 非常感谢任何帮助。


1
为什么这被标记为 shiny??? - jlhoward
已经移除了标签,感谢您指出。 - Patthebug
2个回答

12

我正在做类似的事情,这是我会采取的方法:

  1. Ensure legends are set to 'TRUE' in the ggpairs function call
  2. Now iterate over the subplots in the plot matrix and remove the legends for each of them and just retain one of them since the densities are all plotted on the same column.

    colIdx <- c(3,5,6,7)
    
    for (i in 1:length(colIdx)) {
    
      # Address only the diagonal elements
      # Get plot out of matrix
      inner <- getPlot(p, i, i);
    
      # Add any ggplot2 settings you want (blank grid here)
      inner <- inner + theme(panel.grid = element_blank()) +
        theme(axis.text.x = element_blank())
    
      # Put it back into the matrix
      p <- putPlot(p, inner, i, i)
    
      for (j in 1:length(colIdx)){
        if((i==1 & j==1)){
    
          # Move legend right
          inner <- getPlot(p, i, j)
          inner <- inner + theme(legend.position=c(length(colIdx)-0.25,0.50)) 
          p <- putPlot(p, inner, i, j)
        }
        else{
    
          # Delete legend
          inner <- getPlot(p, i, j)
          inner <- inner + theme(legend.position="none")
          p <- putPlot(p, inner, i, j)
        }
      }
    }
    

谢谢,这个完美地运行了,实现了我所希望的一切。 - Patthebug
2
ggpairs中的legends已经被弃用,但是legend = 1可以使用。 - fry

8
希望有人能展示如何使用 ggpairs(...) 实现这一点。我很想看到那个过程。在那之前,这里提供了一种解决方案,它不使用 ggpairs(...),而是使用普通的基于面板的 ggplot
library(ggplot2)
library(reshape2)   # for melt(...)
library(plyr)       # for .(...)
library(data.table)

xx <- with(df, data.table(id=1:nrow(df), group=Region, df[,c(3,5,6,7)]))
yy <- melt(xx,id=1:2, variable.name="H", value.name="xval")
setkey(yy,id,group)
ww <- yy[,list(V=H,yval=xval),key="id,group"]
zz <- yy[ww,allow.cartesian=T]
setkey(zz,H,V,group)
zz <- zz[,list(id, group, xval, yval, min.x=min(xval),min.y=min(yval),
               range.x=diff(range(xval)),range.y=diff(range(yval))),by="H,V"]
d  <- zz[H==V,list(x=density(xval)$x,
                   y=min.y+range.y*density(xval)$y/max(density(xval)$y)),
         by="H,V,group"]
ggplot(zz)+
  geom_point(subset= .(xtfrm(H)<xtfrm(V)), 
             aes(x=xval, y=yval, color=factor(group)), 
             size=3, alpha=0.5)+
  geom_line(subset= .(H==V), data=d, aes(x=x, y=y, color=factor(group)))+
  facet_grid(V~H, scales="free")+
  scale_color_discrete(name="Region")+
  labs(x="", y="")

基本思路是将你的df融化为适合于ggplot(xx)的格式,制作两个副本(yyww),并基于idgroup(这里,id只是行号,而groupRegion变量)运行笛卡尔积,以创建zz。我们确实需要在外部计算和缩放密度(在数据表d中)。尽管如此,它仍然比ggpairs(...)运行得更快。

谢谢你的回答。我们能否摆脱那些没有太大贡献的上三角矩阵?我最初使用ggpairs的原因是只显示相关信息。 - Patthebug
1
不,无法独立设置分面主题。 - jlhoward

网页内容由stack overflow 提供, 点击上面的
可以查看英文原文,
原文链接