向scatter3d图中添加图例

6

其中一个可用于交互式3D图形绘制的软件包是rgl。我想要做的是构建一个带有颜色编码的三维散点图,根据某些因子变量进行编码。该三维散点图是基于plsr分析得出的载荷结果。
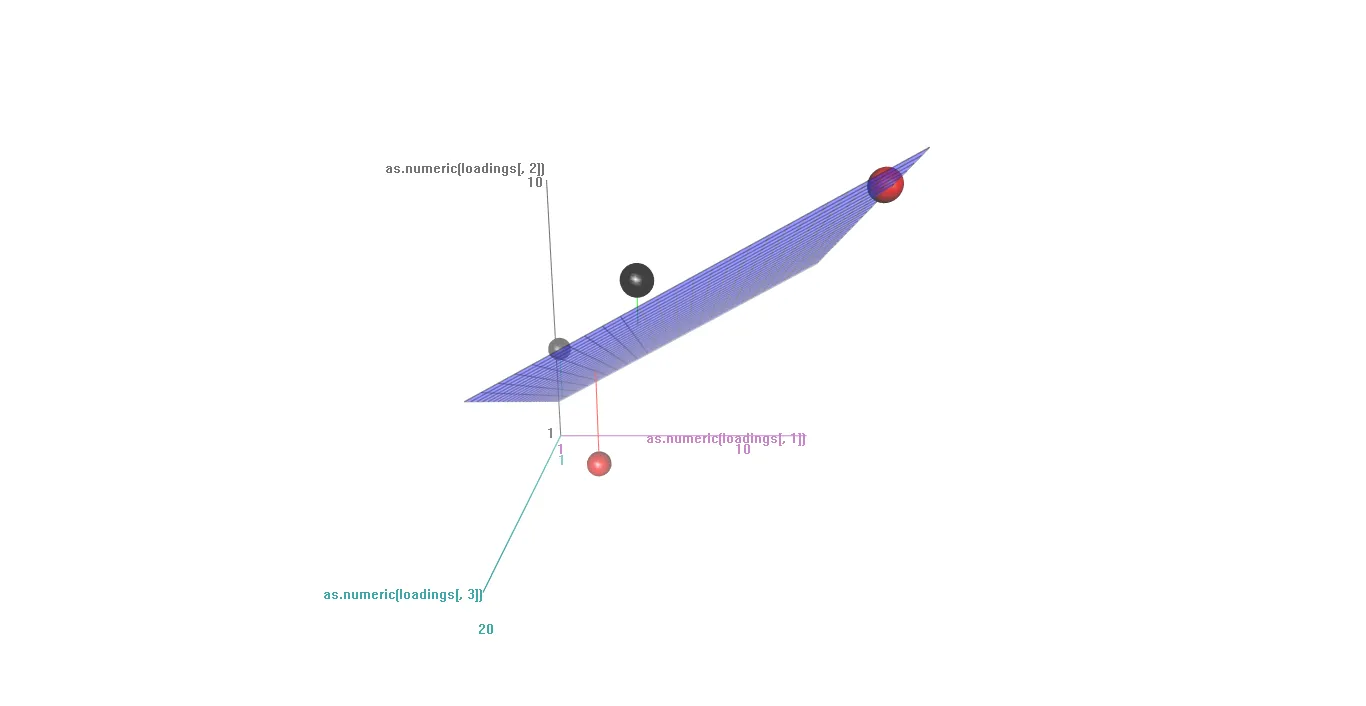
生成的图表如下所示:

3D scatterplot of PLS loadings with color coding according to the groups of variables

下面是示例数据的表格:

> loadings

      |      Comp 1         |        Comp 2            |    Comp 3           | Class
-------------------------------------------------------------------------------------------                    
TEMP  | -0.0607044182964255 | "0.0437618450165671"     |"0.045124991801441"  | "global"  
MW    | "-0.13414890573833" |   "-0.0970537799069731"  |0.263043734662182"   | "local" 
DM    |"-0.183751529577861" |  "-0.102703237685933"    |"0.0640549385564205" | "global" 
CHG   |"-0.0558781715833019"| "0.125155347350922"      |"-0.119258450107321" | "local"

或者可以生成:
loadings <- data.frame(Comp1 = c(1.2, 3.4, 5.6, 13.1), Comp2 = c(4.3, 1.2, 7.7, 9.8),
                       Comp3 = c(1.2,6.9,15.6,15.0), 
                       row.names = c("TEMP", "MW", "DM", "CHG"), 
                       Class = c("global", "local", "global", "local"))
scatter3d(x=loadings[[1]], y=loadings[[2]], z=loadings[[3]], 
          point.col = as.numeric(as.factor(loadings[,4])), size = 10)

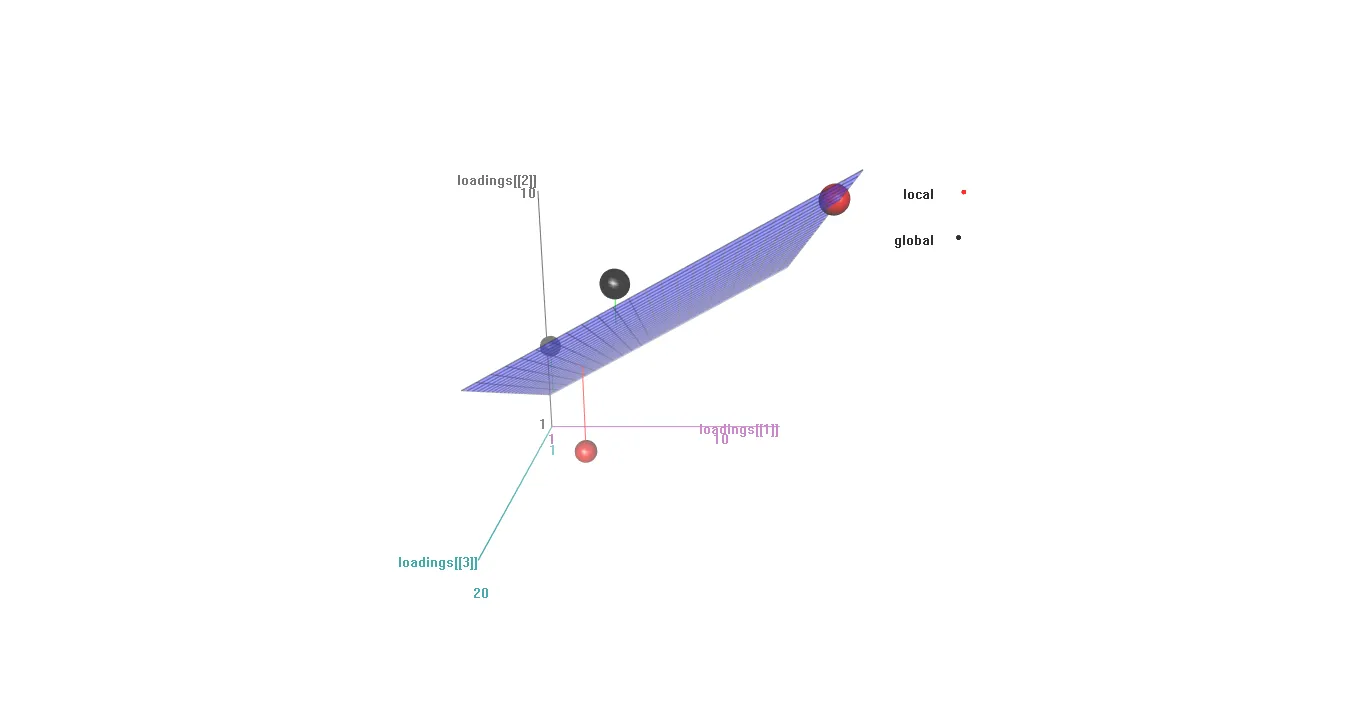
获得的图形具有相同的风格,但更简单,因为变量“Class”只有两个级别:“全局”和“本地”。

enter image description here

问题是: 是否可以在rgl中添加图例,或者可以将一些独立的图例附加到图形上?

答案是:

scatter3d(x=loadings[[1]], y=loadings[[2]], z=loadings[[3]], 
          point.col = as.numeric(as.factor(loadings[,4])), size = 10, type = 's')
text3d(x=1.1, y=c(.9,1), z=1.1,levels(loadings[[4]]),col="black")
points3d(x=1.2,y=c(.9,1),z=1.1, col=as.numeric(as.factor(loadings[,4])), size=5)
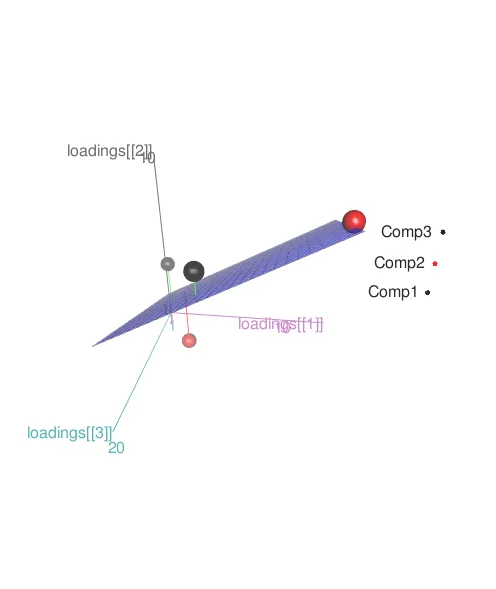
按类别标注的图表: enter image description here

请在您的问题中添加代码和数据(真实或虚构),以创建一个最小可重现示例 - SlowLearner
那段新代码抛出了一个错误:"complete.cases(x, y, z)的错误:..."。 - IRTFM
2个回答

1

我使用了公式方法来创建分组,并通过将它们变为白色来“删除”组标签,因为我无法找到更简单的方法来实现这一点。然后,我使用legend3d创建了一个图例...这非常简单。只需确保点和图例颜色匹配即可。也许这有些笨拙,但它完成了我需要做的事情!

scatter3d(Biomass~Salinity*Moisture|Competitor, data=phrag19, labels=FALSE,
    surface=FALSE,
      grid = FALSE, 
        ellipsoid = FALSE,
    axis.col = c("black", "black", "black"),
    text.col=c("white","white","white","white","white","white","white"),
    surface.col=c("#1D1B1A","#C70039", 
"#94CC00","#A5D7F3","#D2A7DC","#1CAD7A","#FFB114"))

legend3d("right", legend = levels(phrag19$Competitor),
   col =  c("#1D1B1A","#C70039", "#94CC00","#A5D7F3","#D2A7DC","#1CAD7A","#FFB114"), 
pch = 18)

{{link1:legend3d}}

(注:本段为程序代码)

1

这不是一个 plot3d 图像(除非你也加载了其他包),但看起来像是使用 John Fox 的 car 包中的 scatter3d 函数构造的 scatter3d 渲染图:

  require(rgl)
  require(car)
  scatter3d(x=loadings[[1]], y=loadings[[2]], z=loadings[[3]], 
            point.col = as.numeric(as.factor(loadings[,4])), size = 10)

scatter3d函数确实依赖于rgl函数,但具有相当多的自定义选项。您没有提供构建“图例”的代码,因此我尝试使用rgl::text3d中提供的示例进行了一些操作:

 text3d(1+ font/8, 1+cex/4, 1+famnum/8, text=paste(family, font), adj = 0.5, 
       color="blue", family=family, font=font, cex=cex)

enter image description here

有了这些新数据,可以响应文本和点的请求:

 scatter3d(x=loadings[[1]], y=loadings[[2]], z=loadings[[3]], 
             point.col = as.numeric(as.factor(loadings[,4])), size = 10)
 text3d(x=1.1, y=c(.9,1,1.1), z=1.1, names(loadings) ,col="black")
 points3d(x=1.2,y=c(.9,1,1.1),z=1.1, col=as.numeric(as.factor(loadings[,4])), size=5)

enter image description here


是的,确实是scatter3d,已经修复了。看起来很好,但有点奇怪且不太具有信息性。请检查一下文本。我需要在图例中有颜色标签,对应于数据点的颜色标签。 - Boddha
按照演示的方式以结构化的方式绘制点和文本应该不太困难。您需要详细描述所需内容。 - IRTFM

网页内容由stack overflow 提供, 点击上面的
可以查看英文原文,
原文链接