我试图绘制一条带有箭头的线段,并使它在图例中显示。我可以通过以下代码实现:
library(ggplot2)

# sample data
dat <- data.frame(
  x = as.factor(1:10),
  y = c(20,30,13,37,12,50,31,2,40,30),
  z = rep('a', 10)
)

# basic plot
ggplot(dat) +
  geom_segment(
    aes(x = x, xend = x, y = 0, yend = y+15, linetype = z),
    arrow = arrow(length = unit(0.25, 'cm'), type = 'closed'),
    size = 0.7
  )
输出:
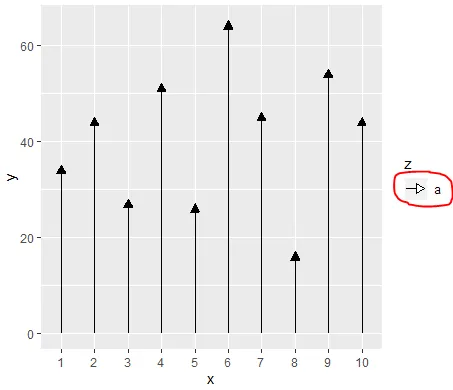
问题:
我的问题是图例中的箭头不像图形一样填充。我尝试使用 guide_legend(override.aes = aes(fill='black')) 和 guide_legend(override.aes = aes(type='closed')),但对图例没有任何影响。
有人知道如何制作黑色实心三角形吗?
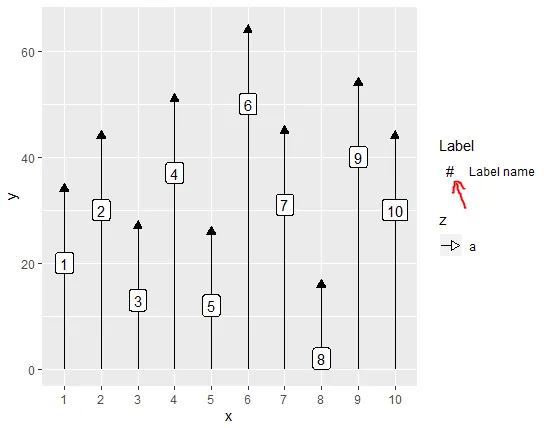
编辑:
我有一个类似的问题,geom_label 中的标签周围没有黑色线条出现在图例中。我设法通过在我想要的确切位置添加一个 geom_rect 来解决这个问题,但希望这不是最好的解决方案:P
任何一个问题的解决方案都会非常有帮助!