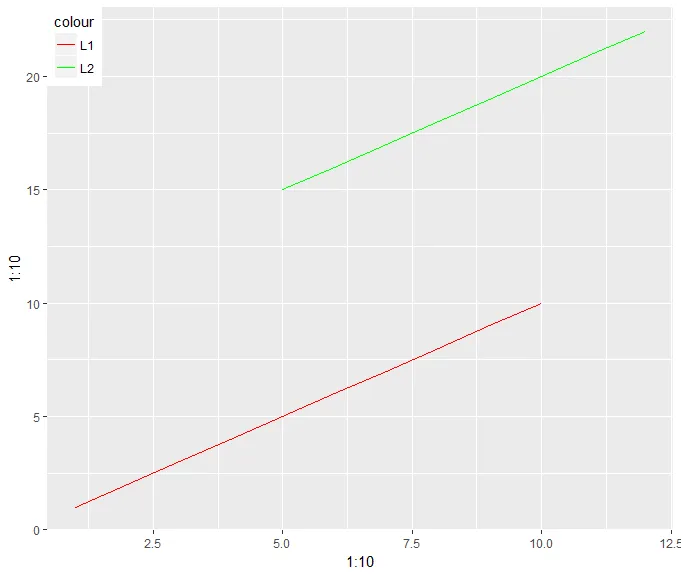
ggplot图例未显示。

3
以下代码未显示图例:
library(ggplot2)
g=ggplot() 
g=g+geom_line(aes(x=1:10,y=1:10),color="red",size=0.2)
g=g+geom_line(aes(x=5:12,y=15:22),color="green",size=0.2)
g=g+theme(legend.position = c(0, 1),legend.justification = c(0, 1))
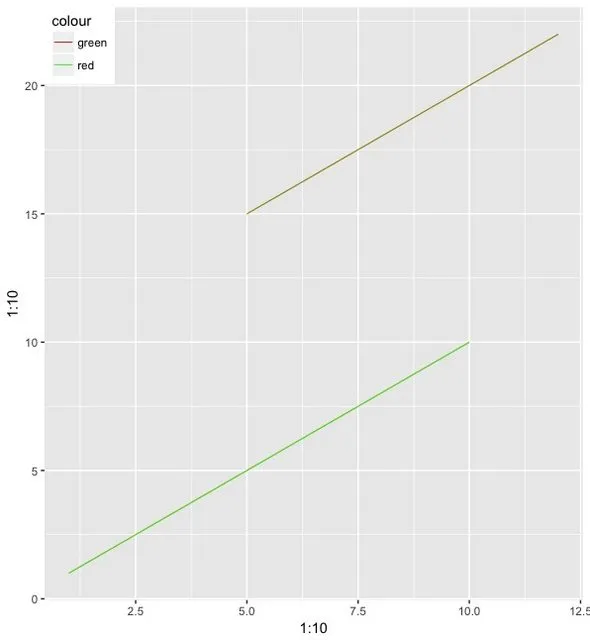
g=g+scale_color_manual(values = c("red","green"))
g

我搜索了整个互联网,却没有找到答案。请注意,由于这两条线的x坐标不同,因此我无法使用ggplot(aes(...))或数据框。

2个回答

2

您需要在aes调用中映射颜色 - 目前没有颜色比例尺可供显示。

例如,考虑以下内容

library(ggplot2)
colors <- c("L1" = "red", "L2" = "green")
g=ggplot() 
g=g+geom_line(aes(x=1:10,y=1:10, color="L1"),,size=0.2)
g=g+geom_line(aes(x=5:12,y=15:22, color="L2"),size=0.2)
g=g+theme(legend.position = c(0, 1),legend.justification = c(0, 1))
g=g+scale_color_manual(values = colors)
g

enter image description here


1
为此,您应将color放在aes中:
library(ggplot2)
g=ggplot() 
g=g+geom_line(aes(x=1:10,y=1:10,color="red"),size=0.2)
g=g+geom_line(aes(x=5:12,y=15:22,color="green"),size=0.2)
g=g+theme(legend.position = c(0, 1),legend.justification = c(0, 1))
g 


那个图例让我眼睛疼。急需 scale_color_manual() - Tung

网页内容由stack overflow 提供, 点击上面的
可以查看英文原文,
原文链接