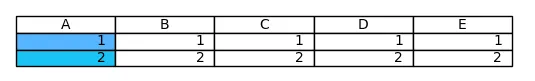
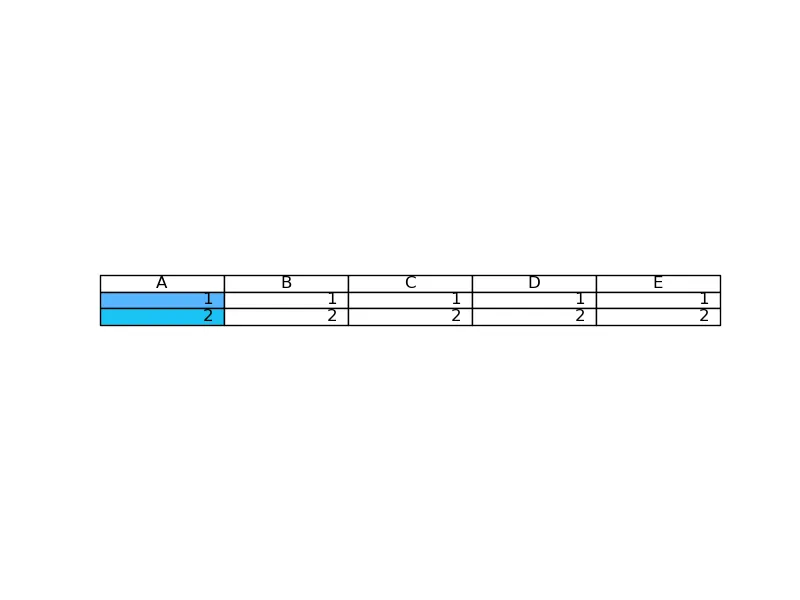
在遵循pylab_examples的基础上,我在matplotlib中创建了一个简单的2x5单元格表。
代码:
# Prepare table
columns = ('A', 'B', 'C', 'D', 'E')
rows = ["A", "B"]
cell_text = [["1", "1","1","1","1"], ["2","2","2","2","2"]]
# Add a table at the bottom of the axes
ax[4].axis('tight')
ax[4].axis('off')
the_table = ax[4].table(cellText=cell_text,colLabels=columns,loc='center')
color = "#56b5fd"给单元格A1上色,并用color = "#1ac3f5"给单元格A2上色。所有其他单元格应保持白色。Matplotlib的table_demo.py以及此示例仅向我展示如何应用具有预定义颜色的颜色映射,这些颜色取决于单元格中的值。如何在Matplotlib生成的表格中为特定单元格分配特定颜色?