我有一个数据集,其中的数值范围是-4到4,还有一些nan值。我使用seaborn heatmap绘制热力图。我需要使用从红色到白色再到蓝色的colormap。我的问题是遮罩单元格也是白色/灰色,这很难区分与colormap中接近0的值。
有没有办法在不重复绘制热力图的情况下将nan值分配为黑色?
你有两个选项。
Use the bad value of the colormap. I.e. if masked values are set to nan, they would be shown in the color set to the colormap via
colormap.set_bad("black")
Make the background of the axes black, such that values which are masked and hence not plotted appear as transparent with the background color see through,
ax.set_facecolor("black")
.cm.get_cmap在matplotlib 3.7中已被弃用
mpl.colormaps['viridis']或mpl.colormaps.get_cmap('viridis')import seaborn as sns
import numpy as np
import matplotlib as mpl
np.random.seed(2023)
matrix = np.random.random_sample(size=(10, 10)) - 0.5
mask = np.where(np.logical_or(matrix >= 0.2, matrix <= -0.2), True, False)
cmap = mpl.colormaps.get_cmap('viridis')
cmap.set_bad("k")
sns.heatmap(matrix, cmap=cmap, mask=mask)
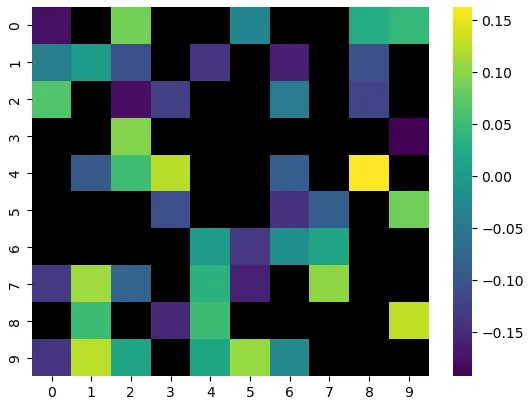
这里是一个完整的例子:
import matplotlib as mpl
import seaborn as sns
cmap = mpl.cm.get_cmap('gray_r')
cmap.set_bad("white")
sns.heatmap(..., cmap=cmap)