Seaborn热力图中按行进行颜色缩放

4
我希望在Seaborn中制作热力图,其中颜色按行缩放。我的意思是,在图例中,一行中的最高值具有最高的颜色,一行中的最低值具有最低的颜色。我该怎么做?
这是我的代码:
sales = sales.pivot_table(index='Sources', columns='Category', values='Value')

sns.heatmap(sales,annot=True, cmap='coolwarm',fmt='g',linewidths=1,linecolor='black',).set_title('Sales')

这是我从中获取的热力图

enter image description here


Giepard的地图看起来还不错。你有什么期望? - Zaraki Kenpachi
2个回答

3
使用numpy.argsort函数,您可以找到每行中值的顺序。将结果作为基础进行着色,这将为每行提供映射。
import numpy as np; np.random.seed(42)
import matplotlib.pyplot as plt
from matplotlib.ticker import FixedFormatter

data = np.random.randint(1,250, size=(10,6))
b = np.argsort(np.argsort(data, axis=1), axis=1)

im = plt.imshow(b, aspect="auto", cmap="coolwarm")
plt.colorbar(im, ticks=np.array([0.0, 0.5, 1.0])*b.max(), 
             format=FixedFormatter(["low", "middle", "high"]))

for i in range(data.shape[0]):
    for j in range(data.shape[1]):
        plt.text(j,i,data[i,j], ha="center", va="center")

plt.show()

enter image description here


2
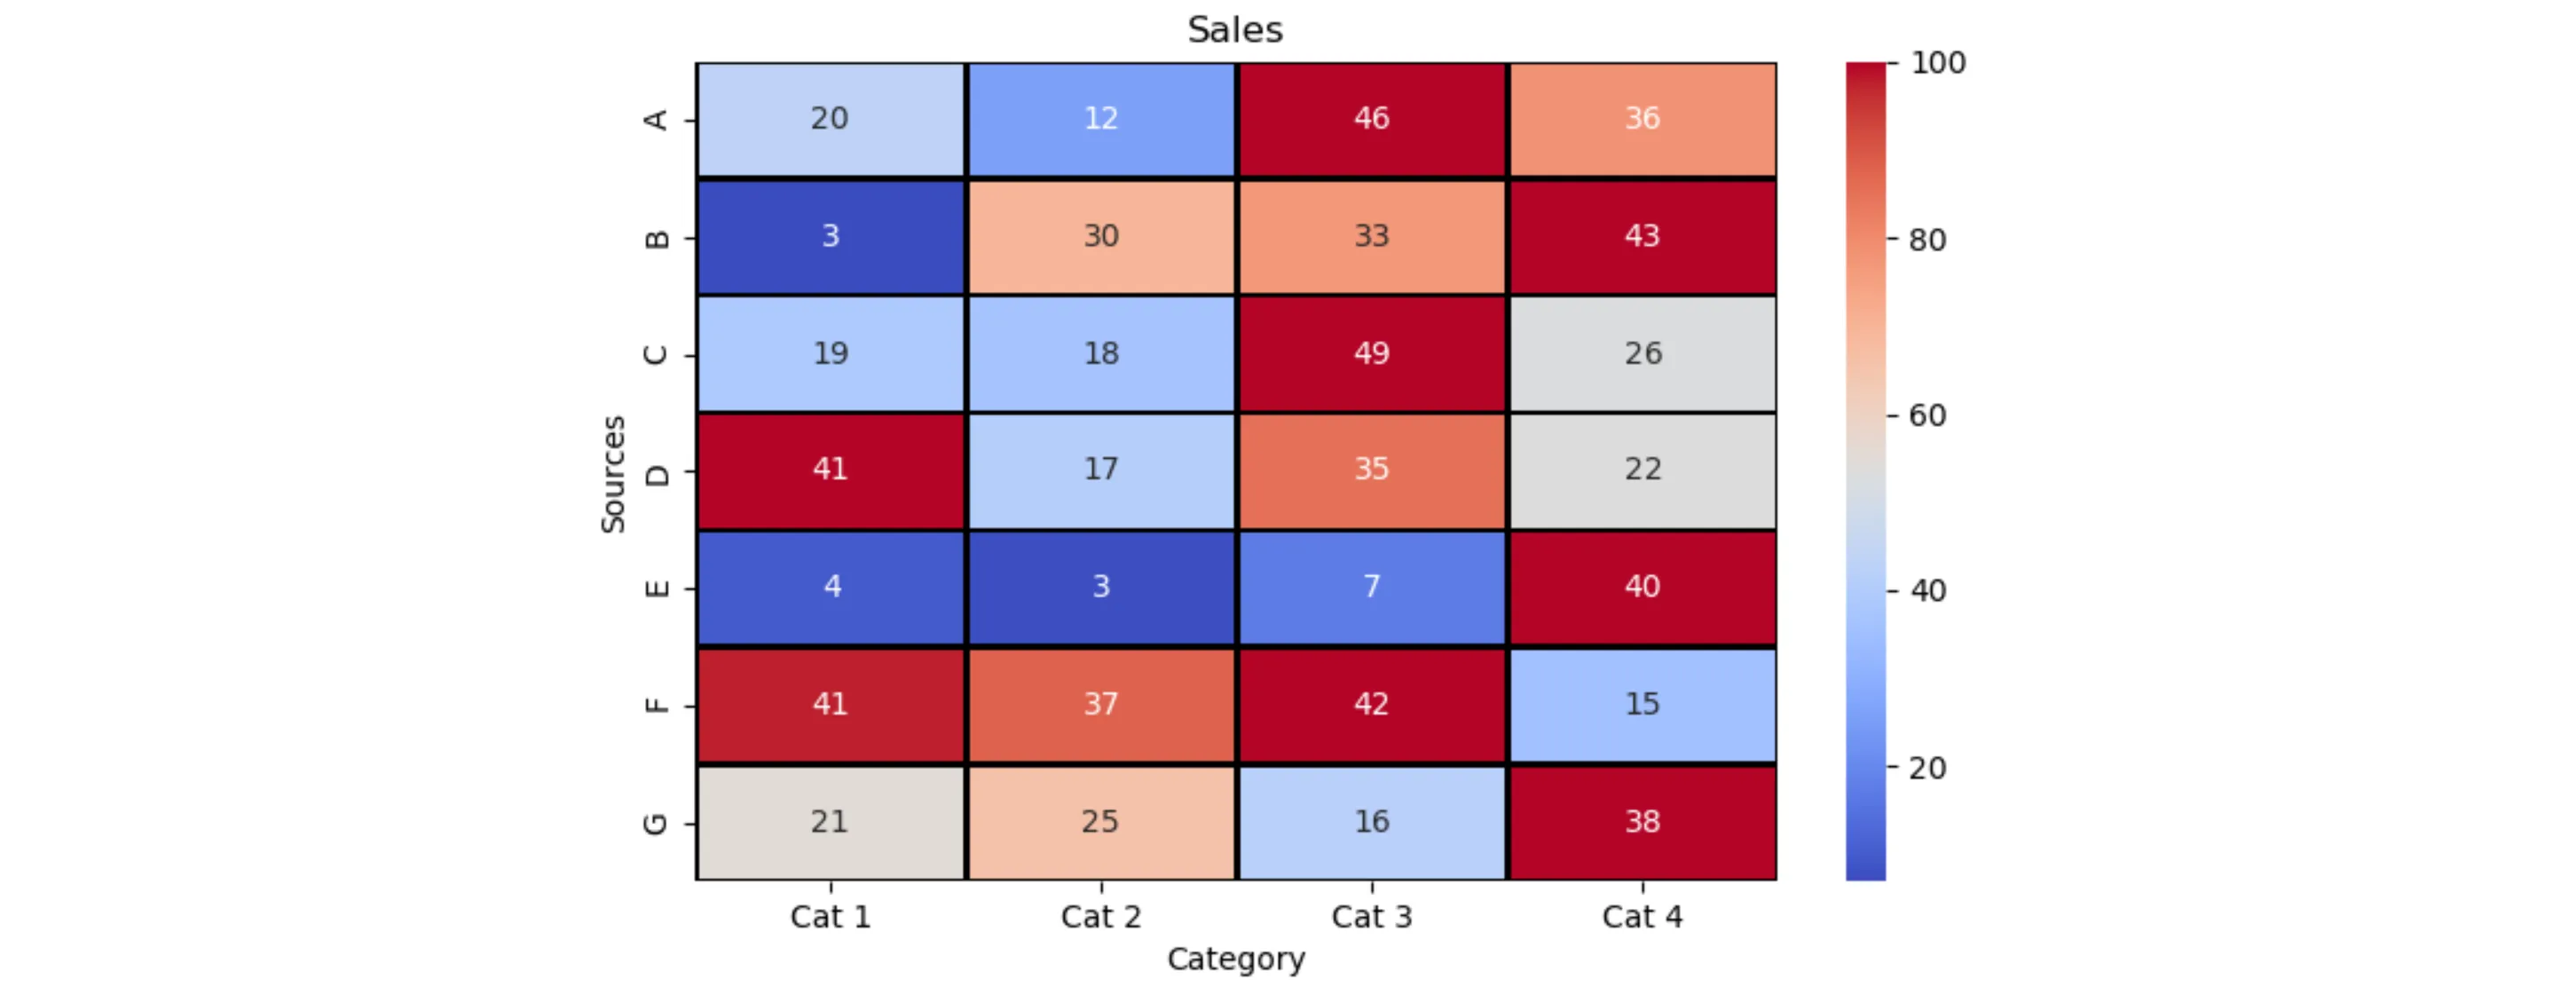
使用pandas将每行除以其最大值,我们可以得到一种颜色编码,其中最大值为深红色,其他列取决于它们与最大值的关系。因此,接近最大值的列将是较浅的红色。销售额仅有一半的列将被涂成白色。几乎没有销售额的列将会是蓝色。
颜色条指示了每行相对于最大值的百分比。
import pandas as pd
import seaborn as sns
from matplotlib import pyplot as plt
import random

sources = ['A', 'B', 'C', 'D', 'E', 'F', 'G']
categories = [f'Cat {i}' for i in range(1, 5)]
data = [[s, c, random.randint(2, 50)] for s in sources for c in categories]
sales = pd.DataFrame(data, columns=['Sources', 'Category', 'Value'])

# create a dataframe grouped by Sources and Category
per_source_cat = sales.groupby(['Sources', 'Category']).agg({'Value': 'sum'})
# calculate the maximum for each source
max_per_source = sales.groupby(['Sources']).agg({'Value': 'max'})
# divide the sales of each source by the maximum for that source
per_source_cat = per_source_cat.div(max_per_source, level='Sources') * 100
# convert to a pivot table
per_source_cat = per_source_cat.pivot_table(index='Sources', columns='Category', values='Value')
# convert the sales to a compatible pivot table
sales = sales.pivot_table(index='Sources', columns='Category', values='Value')
sns.heatmap(per_source_cat, cmap='coolwarm', annot=sales, fmt='g', linewidths=1, linecolor='black', ).set_title('Sales')
plt.show()

example heatmap

另外,假设您想将最高的颜色设置为红色,最低的颜色设置为蓝色,无论它们是否靠近。然后,通过减去最小值并除以最大值和最小值之间的差异,可以定义着色。完全相等的行会导致除以零,可以使用fillna进行处理。
# create a dataframe grouped by Sources and Category
per_source_cat = sales.groupby(['Sources', 'Category']).agg({'Value': 'sum'})
# calculate the maximum and minimum for each source
max_per_source = sales.groupby(['Sources']).agg({'Value': 'max'})
min_per_source = sales.groupby(['Sources']).agg({'Value': 'min'})
# subtract the minimum and divide by the difference between maximum and minimum
per_source_cat = (per_source_cat - min_per_source) / (max_per_source - min_per_source) * 100
# in the case of all equal, there will be a division by 0, set every value to 100 %
per_source_cat = per_source_cat.fillna(100.0)

plot lowest colored blue

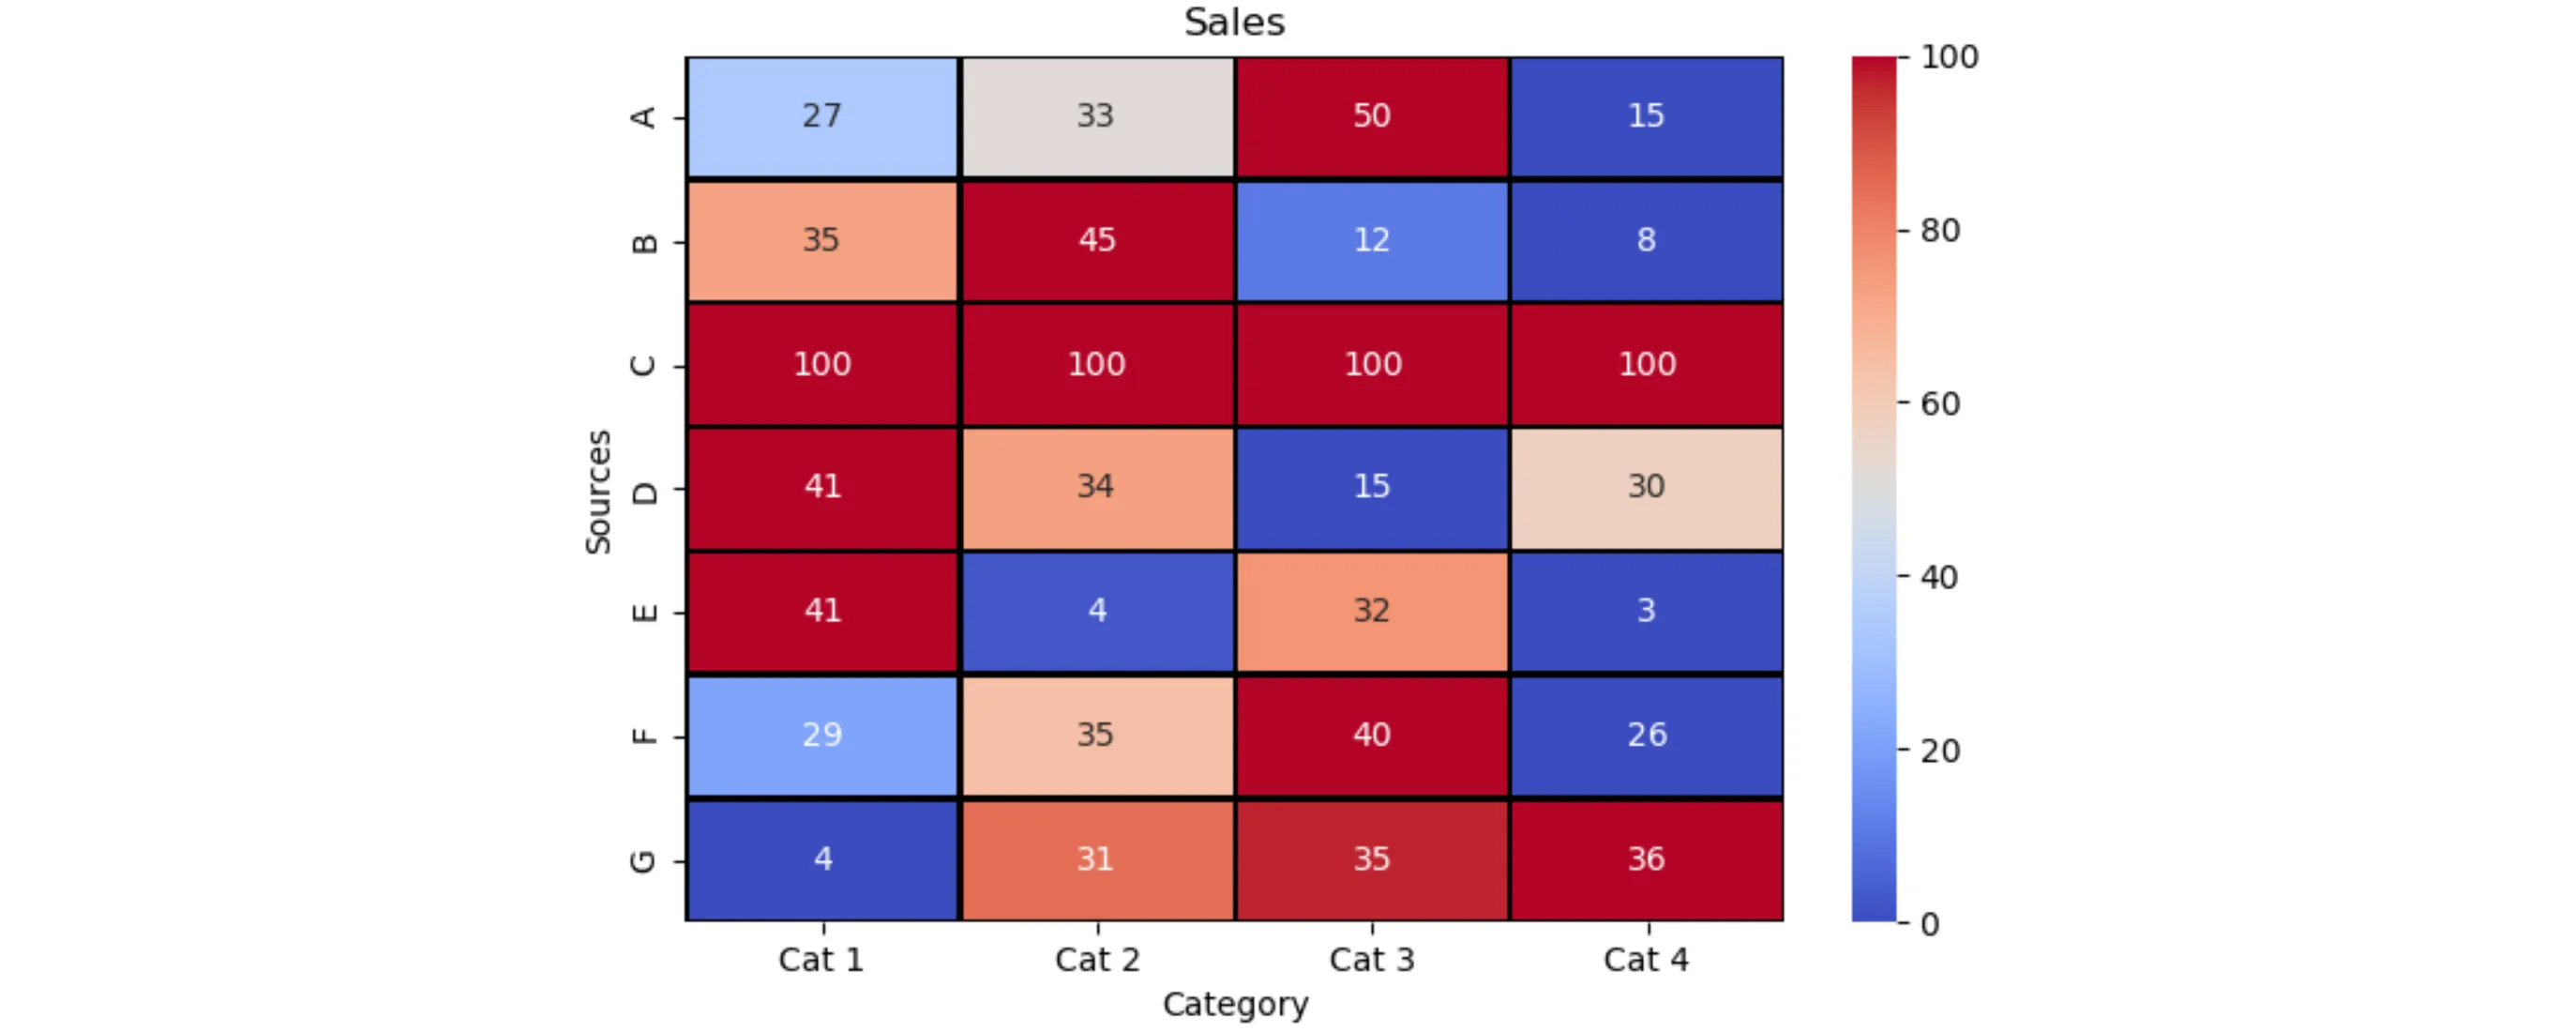
现在,色条指示最高为100%,最低为0%,其余按比例着色。

网页内容由stack overflow 提供, 点击上面的
可以查看英文原文,
原文链接