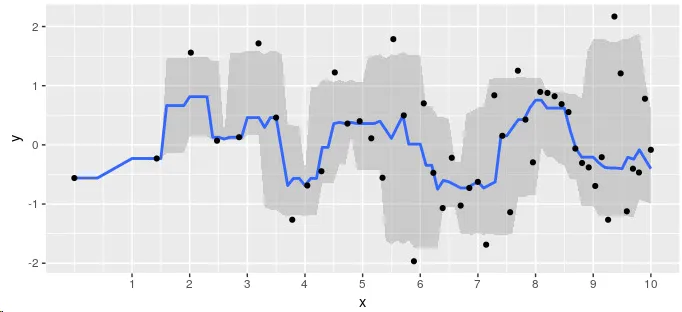
我有一个函数用于计算移动窗口中位数和90%置信区间。对于每个x = seq(xmin, xmax, by = wStep),我返回所有y的中位数和5%和95%分位数,这些y的x值小于wSize/2。我希望通过创建自定义平滑函数stat_movingwindow(),使用ggplot2以线和带状图形式显示结果。我可以使用geom_smooth(data = ..., stat = "identity")创建所需的结果:
moveWin <- function(d, wSize = 0.5, wStep = 0.1,
  f = function(x) quantile(x, prob = c(0.05,0.50,0.95), na.rm = TRUE)
){
  x <- seq(min(d$x), max(d$x), by = wStep)
  y <- matrix(NA, ncol = 3, nrow = length(x))
  for(i in seq_along(x)){
    y[i, ] <- f(d[abs(d$x - x[i]) < wSize/2, ]$y)
  }
  y <- as.tibble(y)
  colnames(y) <- c("ymin","y","ymax")
  y$x <- x
  return(as.tibble(y))
}

set.seed(123)
d <- tibble(
 x= sqrt(seq(0,1,length.out = 50))*10,
 y= rnorm(50)
)

ggplot(data = d) + aes(x = x, y = y) +
  geom_smooth(
    data    = function(d) moveWin(d, wSize = 1, wStep = 0.1),
    mapping = aes(ymin = ymin, ymax= ymax),
    stat    = "identity") +
  geom_point() + scale_x_continuous(breaks = 1:10)
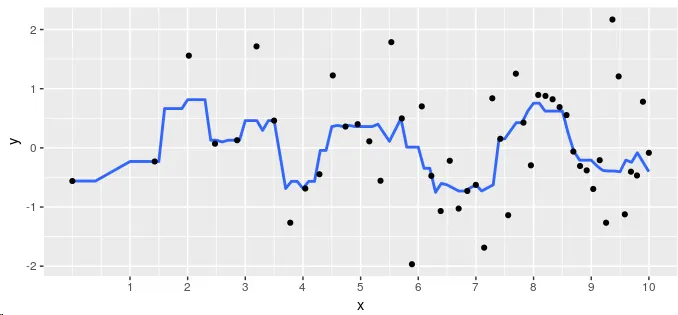
在扩展ggplot2的小插曲(链接)之后,这是我迄今为止想出的代码。然而,问题在于这不显示ribbon。也许我需要一种声明此自定义stat提供美学ymin和ymax的方法。如何使以下代码输出与上述类似的结果?
StatMovingWindow <- ggproto("StatMovingWindow", Stat,
  compute_group = function(data, scales, wSize, wStep, fun) {
    moveWin(data, wSize = wSize, wStep = wStep, f = fun)
  },

  required_aes = c("x", "y")
)
stat_movingwindow <- function(mapping = NULL, data = NULL,
  fun = function(d) quantile(d, probs = c(0.05, 0.50, 0.95), na.rm = TRUE),
  wStep = 0.1, wSize = 1,
  geom = "smooth", position = "identity", show.legend = NA, inherit.aes = TRUE,
  ...
){
  layer(
    stat = StatMovingWindow, data = data, mapping = mapping, geom = geom,
    position = position, show.legend = show.legend, inherit.aes = inherit.aes,
    params = list(wStep = wStep, wSize = wSize, fun = fun, ...)
  )
}

ggplot(data = d) + aes(x = x, y = y) +
  stat_movingwindow(wStep = 0.1, wSize = 1) +
  geom_point() + scale_x_continuous(breaks = 1:10)
stat_movingwindow()内部添加se = TRUE参数? - Z.LinmoveWin函数的定义中添加一个参数se=FALSE,那么如果我调用stat_movingwindow(..., se = TRUE),它就不会被设置为 true。为什么它会得到wStep的值呢?这两个参数都在layer(... params= ...)中列出了? - akraf