我使用Scipy拟合了一些数据:
param=expon.fit(data)
pdf_fitted=expon.pdf(x,loc=param[-2],scale=param[-1])
plot(x,pdf_fitted,'r')
hist(data,normed=1,alpha=.3,histtype='stepfilled')
然后我得到了这样的曲线:
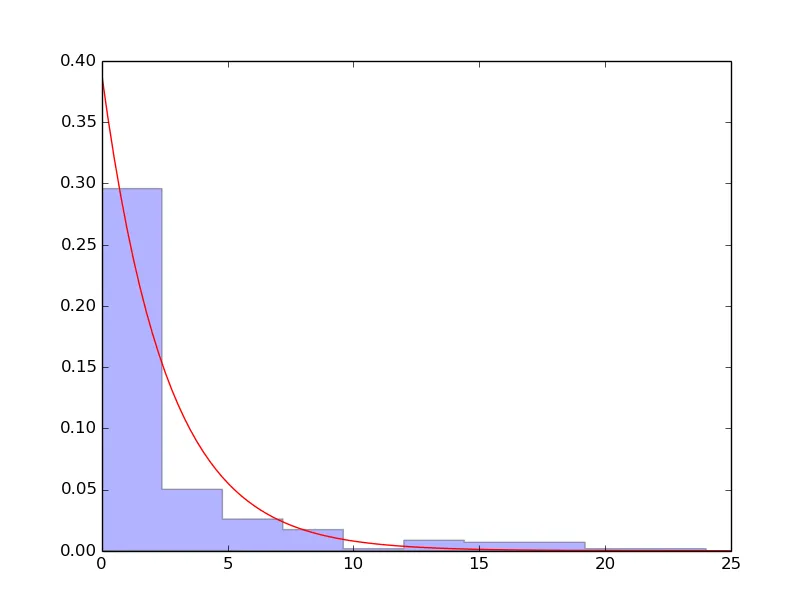
我该如何检查拟合的好坏(是否有相应的参数)?我想要一个数字来比较不同的拟合方法。
我使用Scipy拟合了一些数据:
param=expon.fit(data)
pdf_fitted=expon.pdf(x,loc=param[-2],scale=param[-1])
plot(x,pdf_fitted,'r')
hist(data,normed=1,alpha=.3,histtype='stepfilled')
然后我得到了这样的曲线:
我该如何检查拟合的好坏(是否有相应的参数)?我想要一个数字来比较不同的拟合方法。
标准方法,假设您的误差服从正态分布,是使用平方残差的总和。您可以使用卡方分布将其转化为严格的统计学。
values, edges = np.histogram(data, bins=np.sqrt(len(data)))
x = edges[:-1] + np.diff(edges)

pdf_fitted = expon.pdf(x, loc=param[0], scale=param[1])
residuals = values - pdf_fitted

print np.dot(residuals, residuals)
print np.dot(residuals, residuals) / len(residuals)