Matplotlib表格中的双标题

9

我需要在matplotlib中绘制表格。问题是有些列具有一级标题,而有些列具有双层标题。

以下是我需要的内容:

Table needed

这里是一个简单的示例,用于一级标题:

df = pd.DataFrame()
df['Animal'] = ['Cow', 'Bear']
df['Weight'] = [250, 450]
df['Favorite'] = ['Grass', 'Honey']
df['Least Favorite'] = ['Meat', 'Leaves']
df

enter image description here

fig = plt.figure(figsize=(9,2))
ax=plt.subplot(111)
ax.axis('off') 
table = ax.table(cellText=df.values, colColours=['grey']*df.shape[1], bbox=[0, 0, 1, 1], colLabels=df.columns)
plt.savefig('Table.jpg')

最后一段代码生成了下图:

enter image description here

我需要做哪些更改才能得到所需的表格?

5个回答

11

单元格合并方案

您可以合并由ax.table生成的单元格,就像在Excel电子表格中的单元格合并功能一样。这使得您完全可以使用自动化解决方案,而不需要调整任何坐标(除了要合并的单元格的索引):

import matplotlib.pyplot as plt
import pandas as pd

df = pd.DataFrame()
df['Animal'] = ['Cow', 'Bear']
df['Weight'] = [250, 450]
df['Favorite'] = ['Grass', 'Honey']
df['Least Favorite'] = ['Meat', 'Leaves']

fig = plt.figure(figsize=(9,2))
ax=fig.gca()
ax.axis('off')
r,c = df.shape

# ensure consistent background color
ax.table(cellColours=[['lightgray']] + [['none']], bbox=[0,0,1,1])

# plot the real table
table = ax.table(cellText=np.vstack([['', '', 'Food', ''], df.columns, df.values]), 
                 cellColours=[['none']*c]*(2 + r), bbox=[0, 0, 1, 1])

# need to draw here so the text positions are calculated
fig.canvas.draw()

# do the 3 cell merges needed
mergecells(table, (1,0), (0,0))
mergecells(table, (1,1), (0,1))
mergecells(table, (0,2), (0,3))

输出:

在此输入图像描述

这是上面使用的mergecells函数的代码:

import matplotlib as mpl

def mergecells(table, ix0, ix1):
    ix0,ix1 = np.asarray(ix0), np.asarray(ix1)
    d = ix1 - ix0
    if not (0 in d and 1 in np.abs(d)):
        raise ValueError("ix0 and ix1 should be the indices of adjacent cells. ix0: %s, ix1: %s" % (ix0, ix1))

    if d[0]==-1:
        edges = ('BRL', 'TRL')
    elif d[0]==1:
        edges = ('TRL', 'BRL')
    elif d[1]==-1:
        edges = ('BTR', 'BTL')
    else:
        edges = ('BTL', 'BTR')

    # hide the merged edges
    for ix,e in zip((ix0, ix1), edges):
        table[ix[0], ix[1]].visible_edges = e

    txts = [table[ix[0], ix[1]].get_text() for ix in (ix0, ix1)]
    tpos = [np.array(t.get_position()) for t in txts]

    # center the text of the 0th cell between the two merged cells
    trans = (tpos[1] - tpos[0])/2
    if trans[0] > 0 and txts[0].get_ha() == 'right':
        # reduce the transform distance in order to center the text
        trans[0] /= 2
    elif trans[0] < 0 and txts[0].get_ha() == 'right':
        # increase the transform distance...
        trans[0] *= 2

    txts[0].set_transform(mpl.transforms.Affine2D().translate(*trans))

    # hide the text in the 1st cell
    txts[1].set_visible(False)

1
如果我们想要合并超过两个单元格,有没有什么自动化的方法呢? - MorningGlory
@MorningGlory 我对tel的代码进行了一些更改,并将其发布为答案以支持N个单元格的合并。 - olenscki

6

除了@tel的答案之外,我对他的代码做了一些修改以解决我的问题 - 合并超过两个单元格。这是我得到的:

def mergecells(table, cells):
    '''
    Merge N matplotlib.Table cells

    Parameters
    -----------
    table: matplotlib.Table
        the table
    cells: list[set]
        list of sets od the table coordinates
        - example: [(0,1), (0,0), (0,2)]

    Notes
    ------
    https://dev59.com/jLDla4cB1Zd3GeqP9IBW#53819765
    '''
    cells_array = [np.asarray(c) for c in cells]
    h = np.array([cells_array[i+1][0] - cells_array[i][0] for i in range(len(cells_array) - 1)])
    v = np.array([cells_array[i+1][1] - cells_array[i][1] for i in range(len(cells_array) - 1)])

    # if it's a horizontal merge, all values for `h` are 0
    if not np.any(h):
        # sort by horizontal coord
        cells = np.array(sorted(list(cells), key=lambda v: v[1]))
        edges = ['BTL'] + ['BT' for i in range(len(cells) - 2)] + ['BTR']
    elif not np.any(v):
        cells = np.array(sorted(list(cells), key=lambda h: h[0]))
        edges = ['TRL'] + ['RL' for i in range(len(cells) - 2)] + ['BRL']
    else:
        raise ValueError("Only horizontal and vertical merges allowed")

    for cell, e in zip(cells, edges):
        table[cell[0], cell[1]].visible_edges = e
        
    txts = [table[cell[0], cell[1]].get_text() for cell in cells]
    tpos = [np.array(t.get_position()) for t in txts]

    # transpose the text of the left cell
    trans = (tpos[-1] - tpos[0])/2
    # didn't had to check for ha because I only want ha='center'
    txts[0].set_transform(mpl.transforms.Affine2D().translate(*trans))
    for txt in txts[1:]:
        txt.set_visible(False)

这个代码很好用,但是当我尝试在第一个for循环中使用table[cell[0], cell[1]].set_facecolor('k')来填充合并的单元格时,结果很奇怪。 - user1185790
以上提到的颜色填充问题有什么解决方法吗? - Jorge

5
另一种选择是利用 matplotlib.gridspec.GridSpec 来使用自定义布局绘制值和列:
def format_axes(fig):
    for i, ax in enumerate(fig.axes):
        ax.tick_params(labelbottom=False, labelleft=False, labelright=False)
        ax.get_xaxis().set_ticks([])
        ax.get_yaxis().set_ticks([])


df = pd.DataFrame()
df['Animal'] = ['Cow', 'Bear']
df['Weight'] = [250, 450]
df['Favorite'] = ['Grass', 'Honey']
df['Least Favorite'] = ['Meat', 'Leaves']

fig = plt.figure(figsize=(9, 2))


gs = GridSpec(3, 4, figure=fig, wspace=0.0, hspace=0.0,height_ratios=[1, 1, 4])
# plot table header
ax1 = fig.add_subplot(gs[:-1, 0])
ax1.text(0.5, 0.5, df.columns[0], va="center", ha="center")
ax2 = fig.add_subplot(gs[:-1, 1])
ax2.text(0.5, 0.5, df.columns[1], va="center", ha="center")
ax3 = fig.add_subplot(gs[0, -2:])
ax3.text(0.5, 0.5, "Food", va="center", ha="center")
ax4 = fig.add_subplot(gs[1, -2])
ax4.text(0.5, 0.5, df.columns[2], va="center", ha="center")
ax5 = fig.add_subplot(gs[1, -1])
ax5.text(0.5, 0.5, df.columns[3], va="center", ha="center")
# plot table data
ax6 = fig.add_subplot(gs[-1, :])
table = ax6.table(cellText=df.values, cellLoc='center', bbox=[0, 0, 1, 1])

format_axes(fig)

plt.show()

结果

这里输入图片描述


这是一个不错的解决方案,但我需要将表格放在一个轴上,而不是整个图形上。 - Sergei

2

我猜唯一的方法就是手动添加标题。您可以使用bbox参数控制它们的准确位置和大小。请参阅下面的示例。您可以从此答案中获取更多详细信息:https://stackoverflow.com/a/37440236/2912478

#!/usr/bin/env python

import pandas as pd
import matplotlib.pyplot as plt

df = pd.DataFrame()
df['Animal'] = ['Cow', 'Bear']
df['Weight'] = [250, 450]
df['Favorite'] = ['Grass', 'Honey']
df['Least Favorite'] = ['Meat', 'Leaves']
df

fig = plt.figure(figsize=(9,2))
ax=plt.subplot(111)
ax.axis('off') 

plt.table(cellText=[['Animal', 'Weight']],
                     loc='bottom',
                     bbox=[0, 0.6, 0.5, 0.3]
                     )

plt.table(cellText=[['Food']],
                     loc='bottom',
                     bbox=[0.5, 0.75, 0.5, 0.15]
                     )

plt.table(cellText=[['Favorite', 'Least favorite']],
                     loc='bottom',
                     bbox=[0.5, 0.6, 0.5, 0.15]
                     )

plt.table(cellText=df.values,
                     loc='bottom',
                     bbox=[0, 0, 1, 0.6]
                     )

plt.show()

这是我得到的输出结果:
这里是一个链接:enter image description here

0
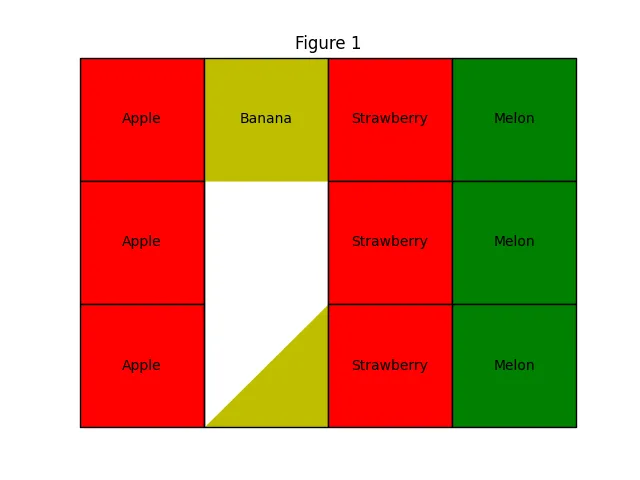
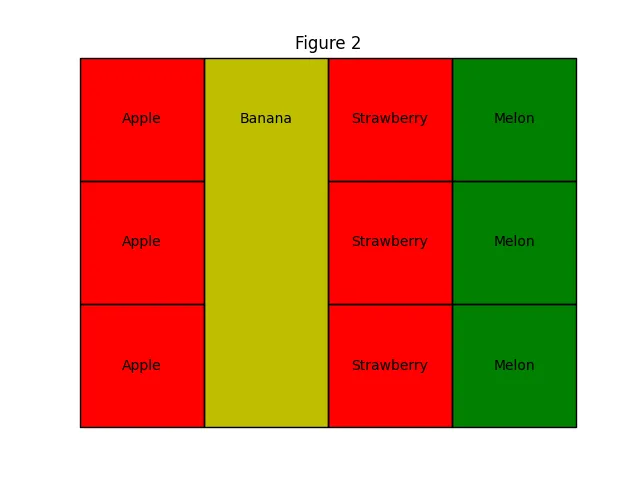
除了@olenscki的回答之外,这里有一个关于单元格背景颜色的技巧。
正如@user1185790和@Jorge所说,如果合并单元格,则cell.set_facecolor()会出现错误。您可以通过像下面这样重叠背景表来避免这种情况。
import numpy as np
import matplotlib as mpl
import matplotlib.pyplot as plt

def mergecells(table, cells):
    '''
    Merge N matplotlib.Table cells

    Parameters
    -----------
    table: matplotlib.Table
        the table
    cells: list[set]
        list of sets od the table coordinates
        - example: [(0,1), (0,0), (0,2)]

    Notes
    ------
    https://dev59.com/jLDla4cB1Zd3GeqP9IBW#53819765
    '''
    cells_array = [np.asarray(c) for c in cells]
    h = np.array([cells_array[i+1][0] - cells_array[i][0] for i in range(len(cells_array) - 1)])
    v = np.array([cells_array[i+1][1] - cells_array[i][1] for i in range(len(cells_array) - 1)])

    # if it's a horizontal merge, all values for `h` are 0
    if not np.any(h):
        # sort by horizontal coord
        cells = np.array(sorted(list(cells), key=lambda v: v[1]))
        edges = ['BTL'] + ['BT' for i in range(len(cells) - 2)] + ['BTR']
    elif not np.any(v):
        cells = np.array(sorted(list(cells), key=lambda h: h[0]))
        edges = ['TRL'] + ['RL' for i in range(len(cells) - 2)] + ['BRL']
    else:
        raise ValueError("Only horizontal and vertical merges allowed")

    for cell, e in zip(cells, edges):
        table[cell[0], cell[1]].visible_edges = e
        
    txts = [table[cell[0], cell[1]].get_text() for cell in cells]
    tpos = [np.array(t.get_position()) for t in txts]

    # transpose the text of the left cell
    trans = (tpos[-1] - tpos[0])/2
    # didn't had to check for ha because I only want ha='center'
    txts[0].set_transform(mpl.transforms.Affine2D().translate(*trans))
    for txt in txts[1:]:
        txt.set_visible(False)


contents = (
    ("Apple", "Banana", "Strawberry", "Melon"),
    ("Apple", "Banana", "Strawberry", "Melon"),
    ("Apple", "Banana", "Strawberry", "Melon")
)
bg_colors = (
    ("r", "y", "r", "g"),
    ("r", "y", "r", "g"),
    ("r", "y", "r", "g")
)


# ///////////////////////////////////////////////////////
# Figure 1: Just merging cells resulting in weired color
fig1 = plt.figure()
ax1 = fig1.add_subplot(111)
ax1.axis("off")
ax1.set_title("Figure 1")
table = ax1.table(cellText=contents, bbox=[0, 0, 1, 1], cellLoc="center", cellColours=bg_colors)
mergecells(table, [(0, 1), (1, 1), (2, 1)])
# ///////////////////////////////////////////////////////


# ///////////////////////////////////////////////////////
# Figure 2: Overlap empty table only for cells color
fig2 = plt.figure()
ax2 = fig2.add_subplot(111)
ax2.axis("off")
ax2.set_title("Figure 2")
# 'table_bg' is a background table without any contents
# Set background color of this as you want
table_bg = ax2.table(bbox=[0, 0, 1, 1], cellColours=bg_colors)
for cell in table_bg._cells.values():
    cell.set_edgecolor("none")
# 'table' contatins cell texts
# Sset its color to 'none' then merge
bg_none = (
    ("none", "none", "none", "none"),
    ("none", "none", "none", "none"),
    ("none", "none", "none", "none")
)
table = ax2.table(cellText=contents, bbox=[0, 0, 1, 1], cellLoc="center", cellColours=bg_none)
mergecells(table, [(0, 1), (1, 1), (2, 1)])
# ///////////////////////////////////////////////////////


plt.show()

Wrong cells color

Corrected cells color


网页内容由stack overflow 提供, 点击上面的
可以查看英文原文,
原文链接