我知道这可能是一个基础问题,但是我在从包含以下数字的单个向量(dat)绘制直方图时遇到一些问题:
30.90 31.00 32.75 32.65 32.50 31.60 31.80 30.70 31.20 28.10 29.50 28.60 31.70 33.10
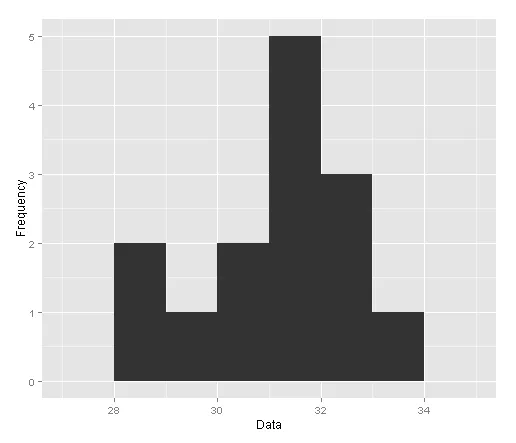
使用qplot很简单:
qplot(PorData, binwidth=1.0, geo="histogram", xlab="Data", ylab="Frequency")
这给我提供了一个默认的直方图:
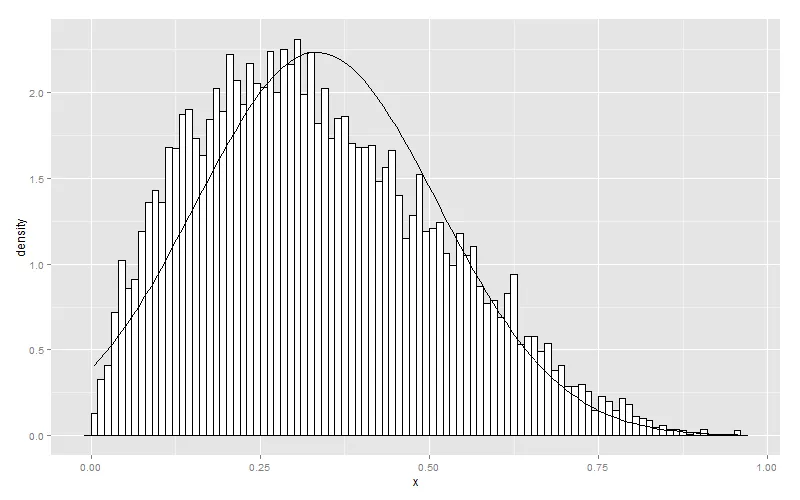
 我想做一个更具美感的直方图,它还将包含显示数据偏斜度的密度曲线,并使用黑色轮廓更改bin颜色,有点像这个:
 是使用qplot函数还是ggplot更好呢?
提前感谢!
是使用qplot函数还是ggplot更好呢?
提前感谢!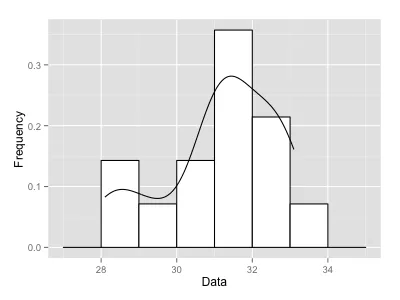
qplot只是一个简化的ggplot函数,它们的功能相同,但提供不同的接口。请注意,这种类型的问题在CV上是不相关的,因为它们与统计学等无关。 - Tim