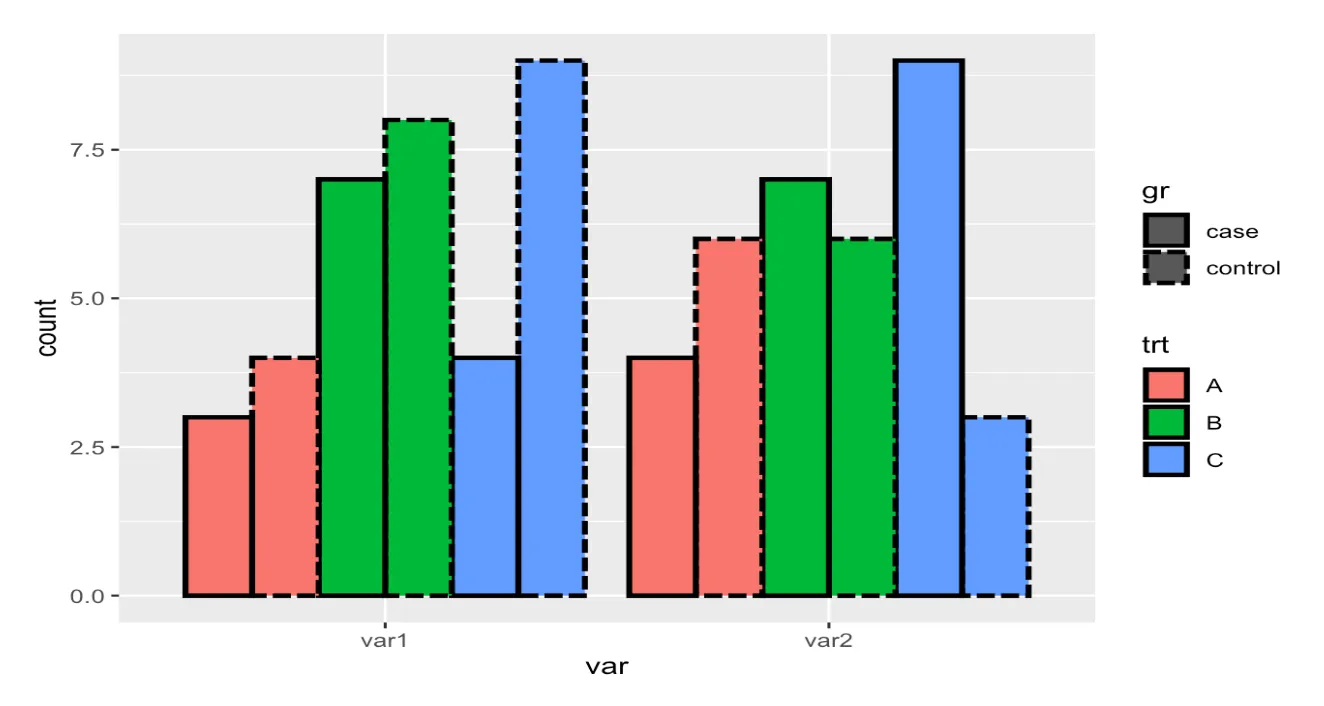
如何在使用ggplot2绘制的条形图中移除线型图例的默认灰色填充?

3
我有一个带有两个不同变量的条形图。 对于因子(gr)之一,我在图中选择了不同的“lintype”。 “gr”的图例显示“lintype”,但具有深灰色填充,我认为这很令人困惑。
有人知道如何去除填充或将其更改为白色或透明吗? (我找到的所有提示都只更改图例的背景,但不影响灰色填充)
    yval <- c(3, 7, 4, 4, 8, 9, 4, 7, 9, 6, 6, 3)
trt <- rep(c("A", "B", "C"), times=4)
gr <- rep(c(rep(("case"), times = 3), rep(("control"), times = 3)), times = 2)
var <- c(rep(("var1"), times = 6), rep(("var2"), times = 6))  
df <- data.frame(yval, device, ccgroup, var)

ggplot(data=df, aes(x=var)) +
  geom_bar( color = "black", size = 1, aes(weights = yval, fill = trt, linetype = gr) , position = "dodge")

Her is the plot

1个回答

6

这可以通过例如guide_legend来实现,它允许您设置图例中使用的填充颜色。请尝试以下操作:

library(ggplot2)

yval <- c(3, 7, 4, 4, 8, 9, 4, 7, 9, 6, 6, 3)
trt <- rep(c("A", "B", "C"), times=4)
gr <- rep(c(rep(("case"), times = 3), rep(("control"), times = 3)), times = 2)
var <- c(rep(("var1"), times = 6), rep(("var2"), times = 6))  
df <- data.frame(yval, trt, gr, var)

ggplot(data=df, aes(x=var)) +
  geom_bar(color = "black", size = 1, aes(weights = yval, fill = trt, linetype = gr) , position = "dodge") +
  guides(linetype = guide_legend(override.aes = list(fill = c(NA, NA))))
#> Warning: Ignoring unknown aesthetics: weights


网页内容由stack overflow 提供, 点击上面的
可以查看英文原文,
原文链接