有点奇怪,我显然漏了什么,我得到了一些非常奇怪的行为,但我无法弄清楚我做错了什么。
我有一个以网格格式排列的子图的绘图(为了方便起见,在本文中,我将仅说一个2x2网格)。我想在每个子图上绘制一些东西,并添加一个圆。应该很容易,但它的表现不像我期望的那样。
示例代码1:
import matplotlib.pyplot as plt

x = [ -1.0, -0.5, 0.0, 0.5, 1.0 ]
y = [  0.7,  0.2, 1.0, 0.0, 0.0 ]

circle = plt.Circle( ( 0, 0 ), 1 )

fig, axes = plt.subplots( 2, 2 )

axes[ 0, 0 ].plot( x, y )
axes[ 1, 1 ].plot( x, y )

axes[ 0, 0 ].add_patch( circle )
axes[ 1, 1 ].add_patch( circle )

plt.show( )
输出 1:
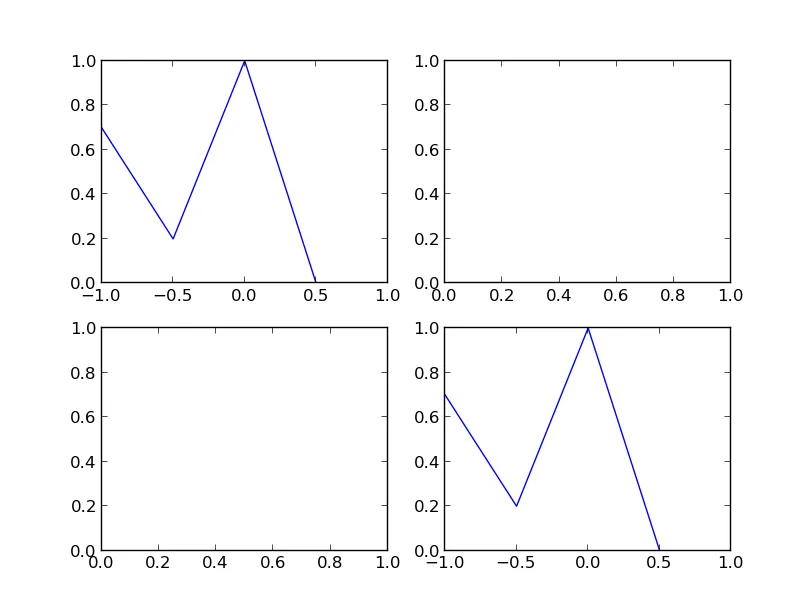
示例代码 2:
import matplotlib.pyplot as plt

x = [ -1.0, -0.5, 0.0, 0.5, 1.0 ]
y = [  0.7,  0.2, 1.0, 0.0, 0.0 ]

circle = plt.Circle( ( 0, 0 ), 1 )

fig, axes = plt.subplots( 2, 2 )

axes[ 0, 0 ].plot( x, y )
axes[ 1, 1 ].plot( x, y )

axes[ 0, 0 ].add_patch( circle )
#axes[ 1, 1 ].add_patch( circle )

plt.show( )
输出2:
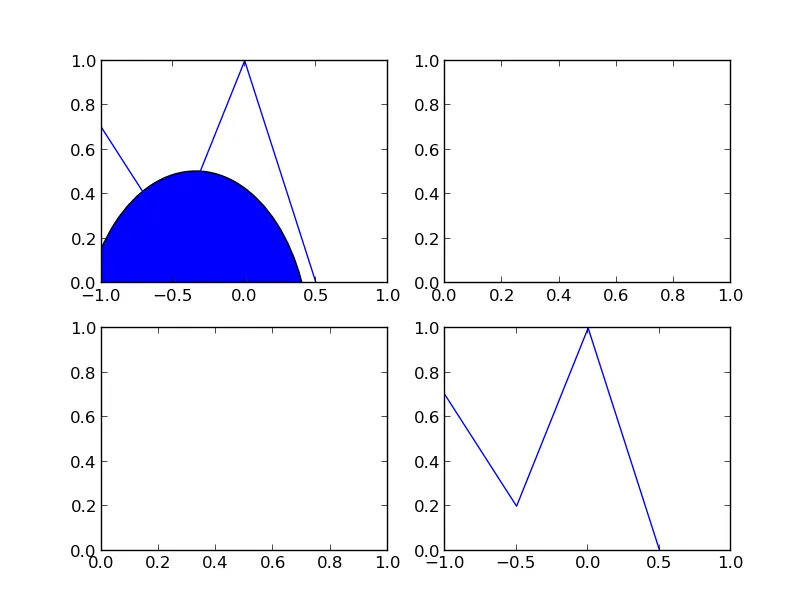
示例代码3:
import matplotlib.pyplot as plt

x = [ -1.0, -0.5, 0.0, 0.5, 1.0 ]
y = [  0.7,  0.2, 1.0, 0.0, 0.0 ]

circle = plt.Circle( ( 0, 0 ), 1 )

fig, axes = plt.subplots( 2, 2 )

axes[ 0, 0 ].plot( x, y )
axes[ 1, 1 ].plot( x, y )

#axes[ 0, 0 ].add_patch( circle )
axes[ 1, 1 ].add_patch( circle )

plt.show( )
输出3:

我真的不明白这种行为(为什么示例2可以工作,但1或3不行?),或者我做了什么导致它发生。有人能帮忙解释一下吗?提前感谢。