我有一系列相关函数,使用matplotlib.pyplot.subplots进行绘图,并且需要在每个子图中包含相应函数的缩放部分。
我开始像这里所解释的那样做,当只有一个图表时它完美地工作,但对于子图则不然。
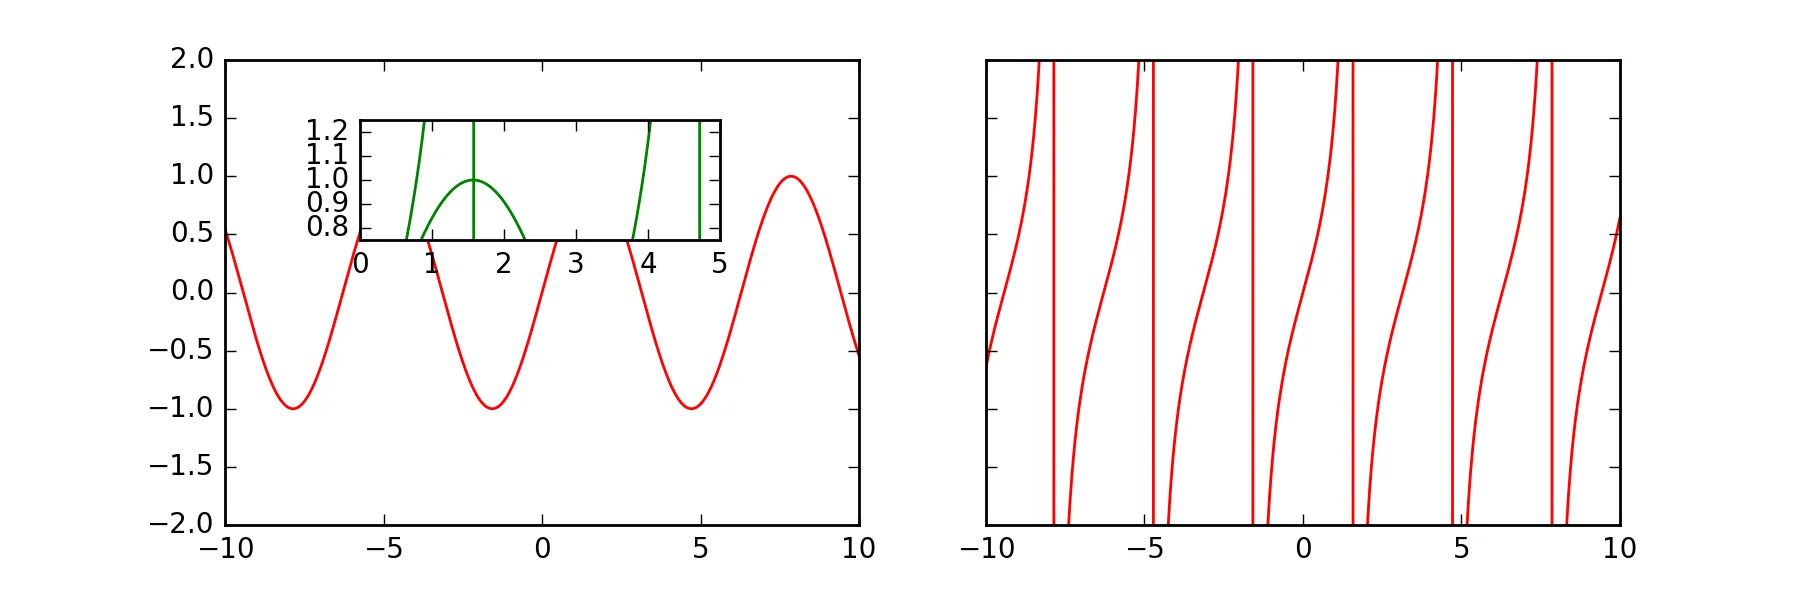
如果我使用子图,则只会得到一个图形,其中包含所有功能。以下是目前所得到的示例:
import numpy as np
import matplotlib.pyplot as plt

x = np.arange(-10, 10, 0.01)
sinx = np.sin(x)
tanx = np.tan(x)

fig, ax = plt.subplots( 1, 2, sharey='row', figsize=(9, 3) )

for i, f in enumerate([sinx, cosx]):
    ax[i].plot( x, f, color='red' )
    ax[i].set_ylim([-2, 2])

    axx = plt.axes([.2, .6, .2, .2],)
    axx.plot( x, f, color='green' )
    axx.set_xlim([0, 5])
    axx.set_ylim([0.75, 1.25])

plt.show(fig)
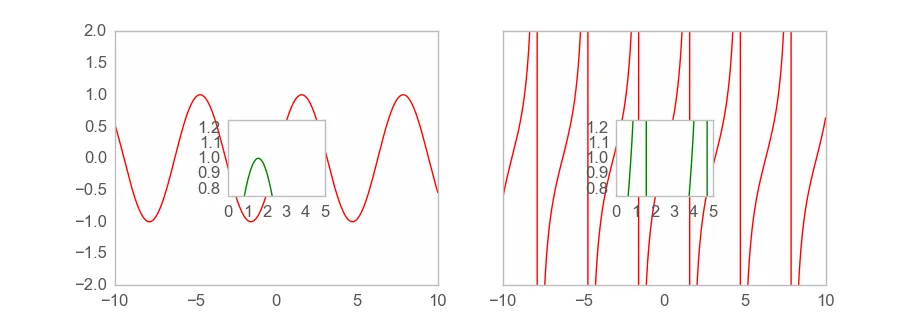
这段代码生成了以下图表:
我该如何在每个子图中创建新的坐标轴并绘制图形?