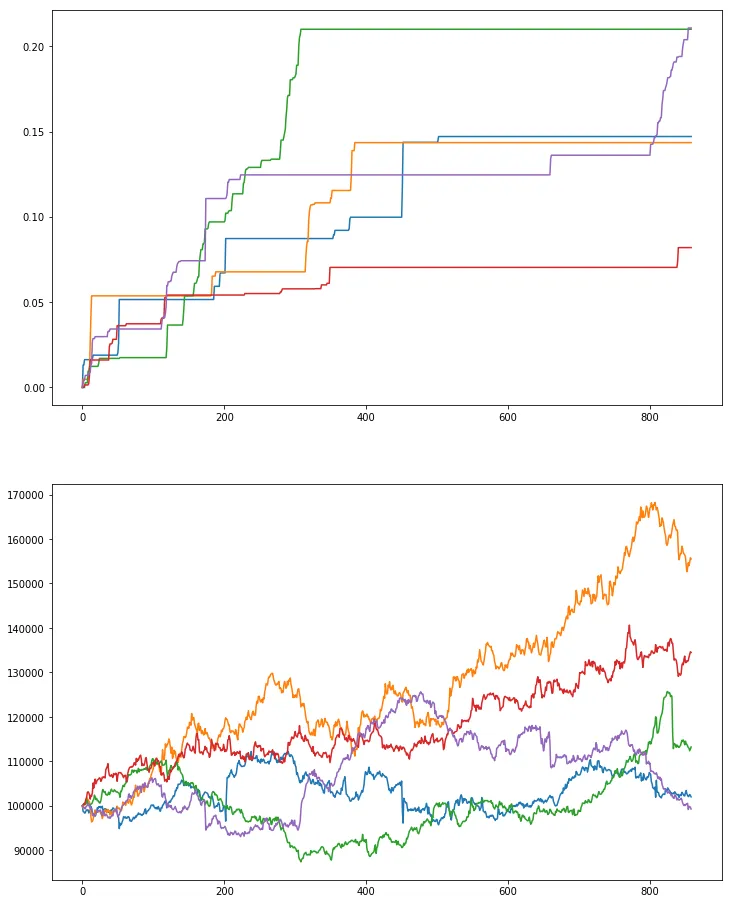
这段代码(matplotlib.pyplot)可以生成下面链接中的图形: plt.subplot(2, 1, 1) plt.plot(px,py) plt.subplot(2, 1, 2) plt.plot(curve) 两个示例图表 --> 我想在第二个子图中添加一条水平线,位置为100.000。如何做到?两个图的颜色应该保持相同/同步。
您可以使用 matplotlib 的 matplotlib.axes.Axes.axhline 方法来添加跨越坐标轴的水平线。如果您需要设置任何其他参数,请参考官方文档。import matplotlib.pyplot as plt plt.axhline(100000, color="gray")