Python Jupyter Notebook:如何在同一图中并排放置两个直方图子图?

9

我正在使用Python(3.4) Jupyter Notebook。我有下面两个柱形图,分别在两个单元格中,每个都有自己的图表:

bins = np.linspace(0, 1, 40)
plt.hist(list1, bins, alpha = 0.5, color = 'r')

并且

bins = np.linspace(0, 1, 40)
plt.hist(list2, bins, alpha = 0.5, color = 'g')

在同一个图中,是否可以将上述两个直方图排列为并排的两个子图?
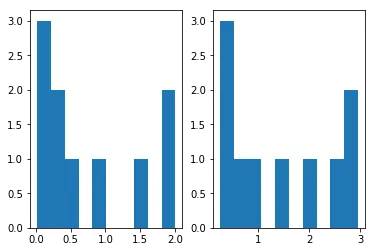
2个回答

18

是的,这是可能的。请查看以下代码。

%matplotlib inline
import matplotlib.pyplot as plt
import numpy as np

list1 = np.random.rand(10)*2.1
list2 = np.random.rand(10)*3.
bins = np.linspace(0, 1, 3)

fig, ax = plt.subplots(1,2)
ax[0].hist(list1, bins, alpha = 0.5, color = 'r')
ax[1].hist(list2, bins, alpha = 0.5, color = 'g')
plt.show()

你能解释一下你对于 bins 表达式的操作吗:np.linspace(0, 1, 3) - fraxture
@fraxture bins是包含直方图分bin边缘的数组。 - ImportanceOfBeingErnest

7
你可以使用matplotlib.pyplot.subplot来实现:
import matplotlib.pyplot as plt
import numpy as np

list1 = np.random.rand(10)*2.1
list2 = np.random.rand(10)*3.0

plt.subplot(1, 2, 1)  # 1 line, 2 rows, index nr 1 (first position in the subplot)
plt.hist(list1)
plt.subplot(1, 2, 2)  # 1 line, 2 rows, index nr 2 (second position in the subplot)
plt.hist(list2)
plt.show()

enter image description here


最好的做法是解释你正在做什么。例如,plt.subplot的参数对于未经培训的人来说并不直观,因此通常也很好包括你的导入 :-) - mgilson
这是一个解决方案,用于回答@Edamame提出的问题,即在一个图中将两个直方图显示为两个并排的子图。 - Tanmoy
@mgilson - Edamame已经在使用plt.hist。因此,他/她已经导入了matplotlib.pyplot作为plt。因此,导入未包含在内。 - Tanmoy
4
@Tanmoy -- 只是因为提问者和你知道并不意味着未来访问这个问题的人会知道。记住,你不仅在回答Edamame的问题--你也在回答将来可能试图完成相同事情的访问者的问题。 - mgilson
@mgilson:我更新了答案,并加入了可用的代码(部分来自其他答案)。这个答案对我很有帮助,所以像你提到的那样,它也可能对其他人有用。 - WoJ

网页内容由stack overflow 提供, 点击上面的
可以查看英文原文,
原文链接