如何在Jupyter Notebook中并排显示图片

7
我使用了以下代码,但是它在 Jupyter Notebook 中以垂直方式显示图片。我希望它们能够并排显示。
display(Image.open(BytesIO(Item[iii][b'imgs'])))
display(Image.open(BytesIO(Item[jjj][b'imgs'])))

我尝试使用这段代码

display(HTML("<table><tr><td>display(Image.open(BytesIO(Item[jjj][b'imgs'])))) 

但它会显示文本 display(Image.open(BytesIO(Item[jjj][b'imgs']))))
请注意,此处使用了HTML标签。

1
你尝试过使用HTML布局吗?display方法也支持HTML。 - cosmoscalibur
创建一个新的图像,将两个图像并排放置在其中。 - Onasafari
是的,我已经尝试使用这段代码 display(HTML("<table><tr><td>display(Image.open(BytesIO(Item[jjj][b'imgs'])))),但它显示的是文本。"display(Image.open(BytesIO(Item[jjj][b'imgs']))))" - Harsha
4个回答

12

使用 ipywidgets 的布局功能,您可以做到这一点

import ipywidgets as widgets
import IPython.display as display
## Read images from file (because this is binary, maybe you can find how to use ByteIO) but this is more easy
img1 = open('image1.jpeg', 'rb').read()
img2 = open('image2.jpeg', 'rb').read()
## Create image widgets. You can use layout of ipywidgets only with widgets.
## Set image variable, image format and dimension.
wi1 = widgets.Image(value=img1, format='png', width=300, height=400)
wi2 = widgets.Image(value=img2, format='png', width=300, height=400)
## Side by side thanks to HBox widgets
sidebyside = widgets.HBox([wi1, wi2])
## Finally, show.
display.display(sidebyside)

谢谢您的回答。但是我无法修改图像的高度和宽度。有什么想法是什么原因呢? - Resham Wadhwa
没问题,那不是必需的美学要求。我想要相同大小的小部件图像。 - cosmoscalibur
有一个有趣的替代品可以使用,它是 pyplot。此外还可以参考这个自定义包 IPyPlot - mins

2
显示两张图片并排放置
import matplotlib.pyplot as plt
img1 = plt.imread('<PATH_TO_IMG1>')
img2 = plt.imread('<PATH_TO_IMG2>')

NUM_ROWS = 1
IMGs_IN_ROW = 2
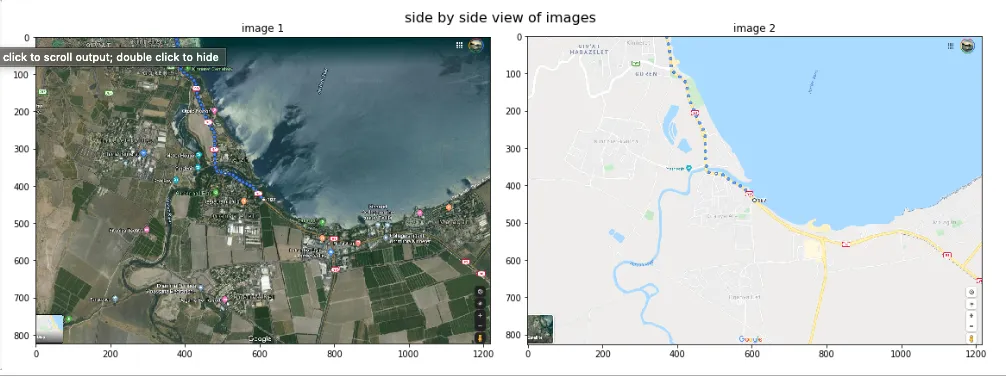
f, ax = plt.subplots(NUM_ROWS, IMGs_IN_ROW, figsize=(16,6))

ax[0].imshow(img1)
ax[1].imshow(img2)

ax[0].set_title('image 1')
ax[1].set_title('image 2')

title = 'side by side view of images'
f.suptitle(title, fontsize=16)
plt.tight_layout()
plt.show()

enter image description here


隐藏刻度和标签对于图像来说更好,确保像素比不被改变也是一个好主意。 - mins

1
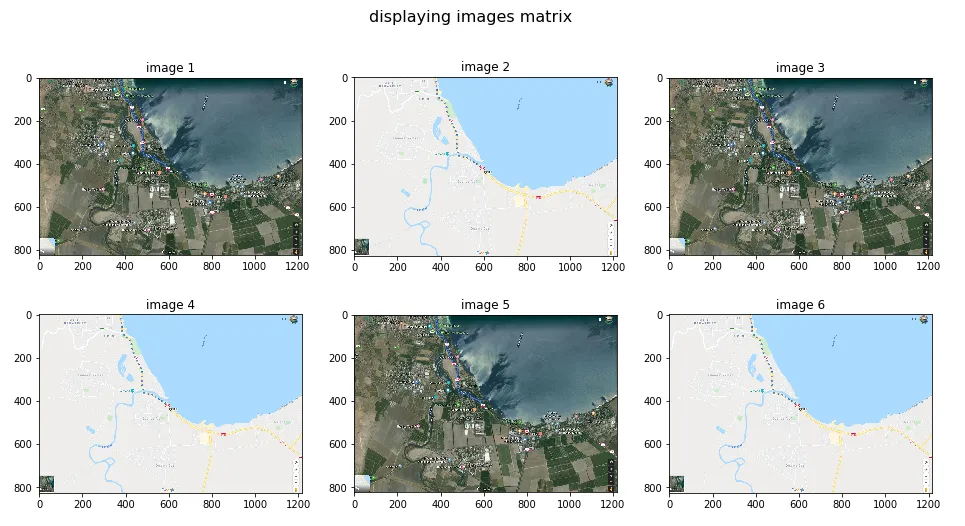
你可以稍微修改上面的代码来显示图像网格。
import matplotlib.pyplot as plt
img1 = plt.imread('<PATH_TO_IMG1>')
img2 = plt.imread('<PATH_TO_IMG2>')
images = [img1, img2]*3

NUM_ROWS = 2
IMGs_IN_ROW = 3

f, ax_arr = plt.subplots(NUM_ROWS, IMGs_IN_ROW, figsize=(16,8))

for j, row in enumerate(ax_arr):
    for i, ax in enumerate(row):
        ax.imshow(images[j*IMGs_IN_ROW+i])
        ax.set_title(f'image {j*IMGs_IN_ROW+i+1}')

title = 'displaying images matrix'
f.suptitle(title, fontsize=16)
plt.show()  

enter image description here


初始答案已经是一个子图网格,但它只有一行。如果你填充一个二维网格,你不知道是否有足够的图片来填满所有的网格单元。如何隐藏空单元格也是很有趣的问题。 - mins

0
你可以使用subplot。
import pylab 
pylab.subplot(1, 2, 1)
pylab.plot(range(10))
pylab.subplot(1, 2, 2)
pylab.plot(range(20))

网页内容由stack overflow 提供, 点击上面的
可以查看英文原文,
原文链接