我在Matplotlib中绘制vlines图,我的数据集中所有y值都为> = 0。 我想让我的y轴底部刻度读取0,但是实际上它显示的是-500。
以下是代码:
#!/usr/bin/env python

import numpy as np
from matplotlib import pyplot as plt, dates as mdates
import datetime as dt, time

# Read the data and turn it into a numpy array
#store = map(lambda line: map(int, line.strip().split()), open(name + '.txt').readlines())
store = [
    [1293606162197, 0, 0],
    [1293605477994, 63, 0],
    [1293605478057, 0, 0],
    [1293605478072, 2735, 1249],
    [1293606162213, 0, 0],
    [1293606162229, 0, 0],
]

nstore = np.array(store)

# Get arrays of each columns in the store array
d = nstore[:,0]
y1 = nstore[:,1]
y2 = nstore[:,2]

# Get arrays of values to be passed to matplotlib
s = d / 1000
dts = map(dt.datetime.fromtimestamp, s)
fds = mdates.date2num(dts)

# new figure and subplot
fig = plt.figure()
ax = fig.add_subplot(111)

# Plot using vlines
ax.vlines(fds, [0], y1, 'red')

# set xaxis tick settings
ax.xaxis.set_major_locator(mdates.MinuteLocator())
ax.xaxis.set_major_formatter(mdates.DateFormatter('%m/%d %H:%M'))

for label in ax.xaxis.get_ticklabels():
    label.set_rotation('vertical')

fig.subplots_adjust(bottom=.25)

# Set the y axis bottom limit to 0
ax.set_ylim(bottom=0)   # <<- THIS DOES NOT SEEM TO BE WORKING

# Save the plot figure
fig.savefig('out.png')
这是我得到的图表:
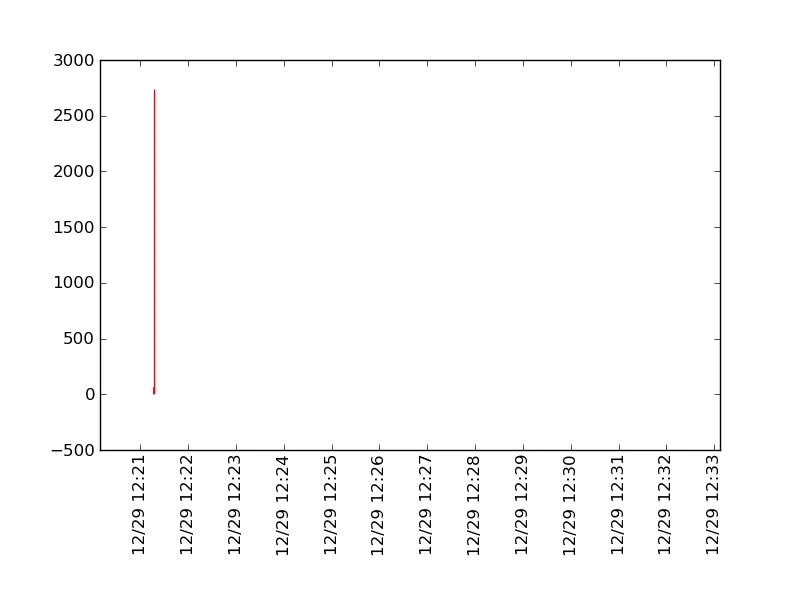
有人可以指出我的问题在哪里吗?如果您能指导我找到所需的详细信息文档,那就太好了。谢谢。
这个问题是 Creating graph with date and time in axis labels with matplotlib 的后续问题。
ax.set_ylim(bottom=0)更改为ax.set_ylim(ymin=0)就像魔法一样奏效,无需调用.draw()。谢谢。 - sharat87matplotlib.__version__显示的是0.99.3,网站上最新版本似乎是1.0.1,该死的 Ubuntu 软件源! - sharat87ax.set_ylim(ymin=…)不会更新图形,而且仍然需要使用pyplot.draw(),就像bottom=…一样。因此,更好的做法可能是始终使用可移植的代码并包括draw()。 :) - Eric O. Lebigotax.set_ylim(ymin=…)是旧语法,已经被答案中的bottom=…废弃。 - Eric O. Lebigot