循环中的Matplotlib图例

5
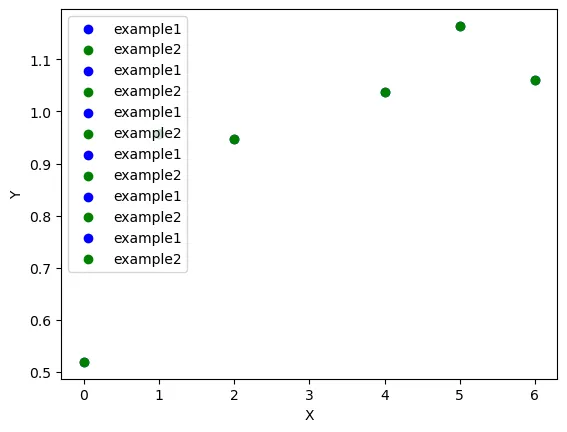
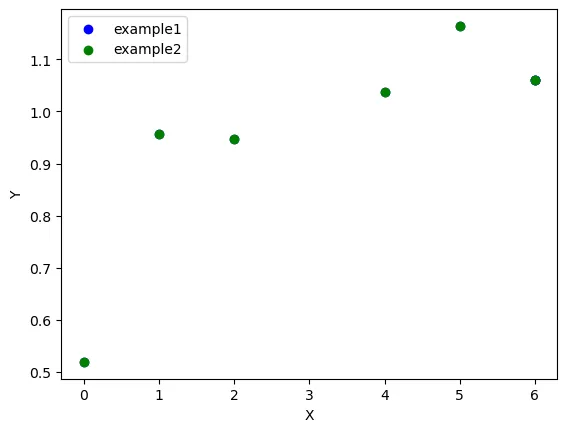
我正在对数据进行分组并在地图上绘制,并为每个分组添加图例,但是每次循环时我的图例中都会出现一条线。如何才能使每个分组只有一条图例线呢?
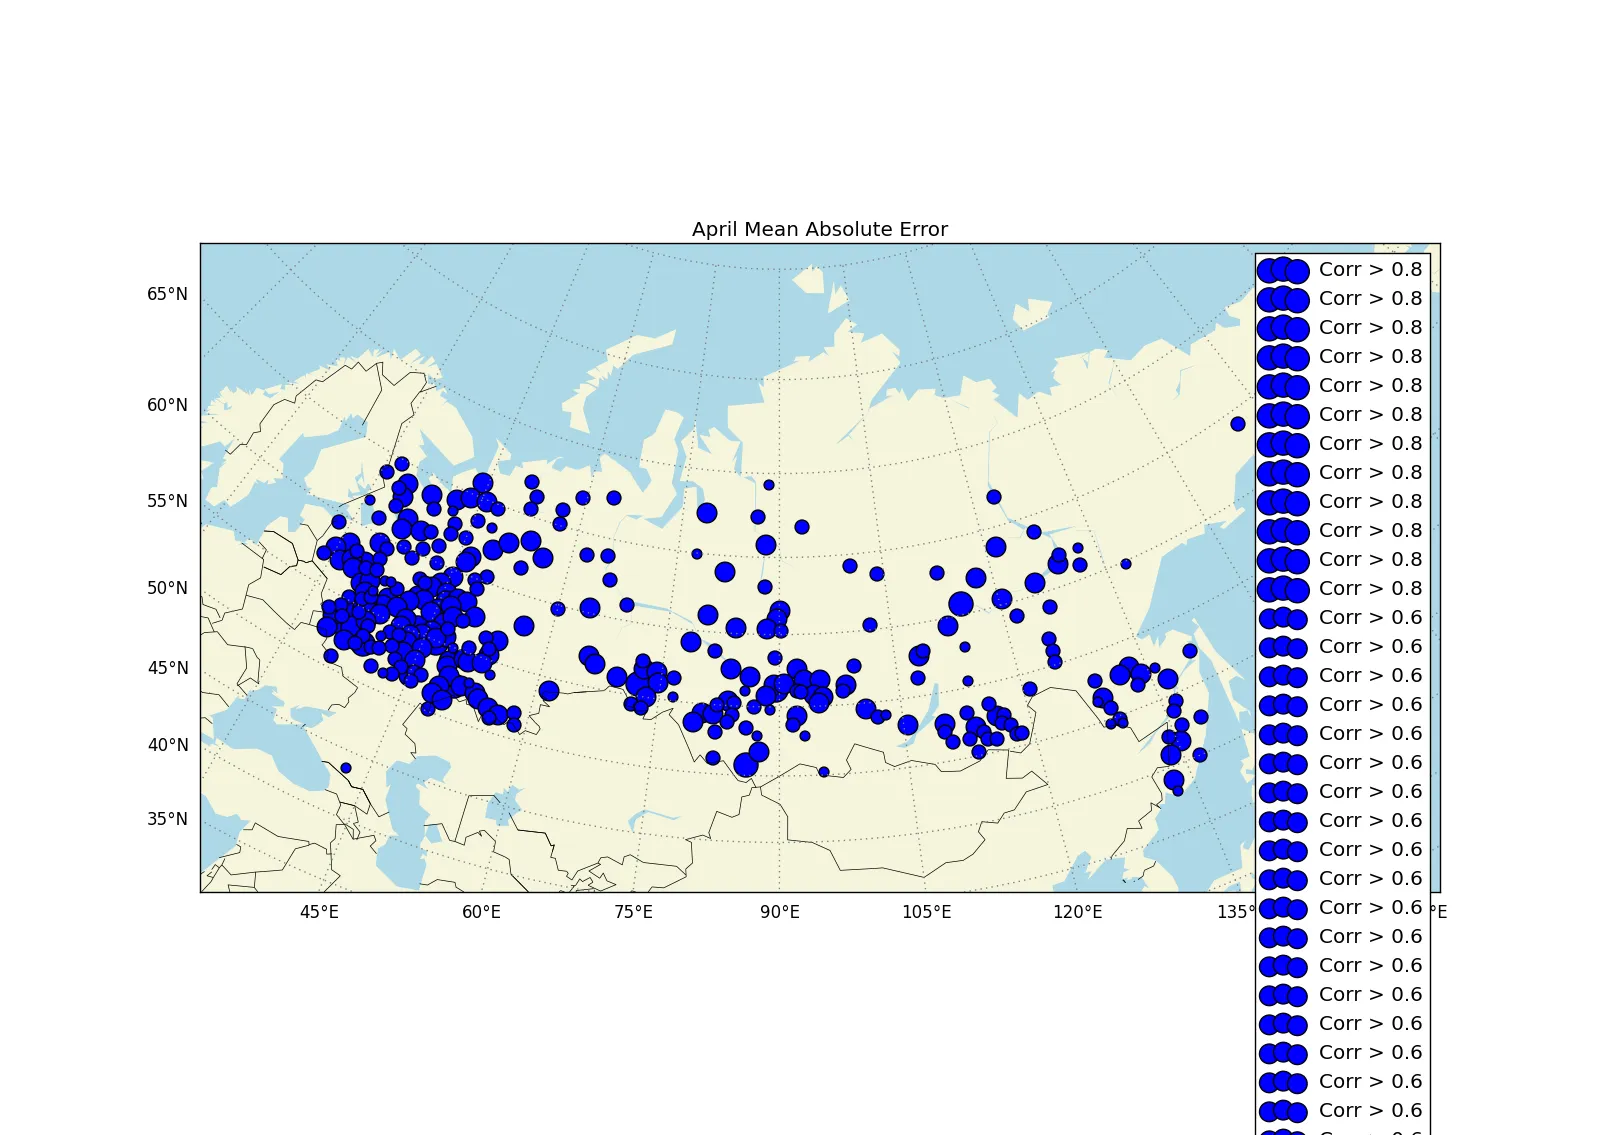
注意:我使用了单独的for循环来确保较小的圆圈绘制在较大的圆圈之上。
图片链接:enter image description here
sigcorrs = np.random.rand(100,1)

m = Basemap(llcrnrlon=35.,llcrnrlat=30.,urcrnrlon=-160.,urcrnrlat=63.,projection='lcc',resolution='c',lat_1=20.,lat_2=40.,lon_0=90.,lat_0=50.)  
m.drawcountries()
m.drawmapboundary(fill_color='lightblue')
m.drawparallels(np.arange(0.,90.,5.),color='gray',dashes=[1,3],labels=[1,0,0,0])
m.drawmeridians(np.arange(0.,360.,15.),color='gray',dashes=[1,3],labels=[0,0,0,1])
m.fillcontinents(color='beige',lake_color='lightblue',zorder=0)
plt.title('Mean Absolute Error')

for a in range(len(clat)):
    if sigcorrs[a] > 0.8:
        X,Y = m(clon[a],clat[a])  
        m.scatter(X,Y,s=300,label='Corr > 0.8')
    else:
        continue

for a in range(len(clat)):
    if sigcorrs[a] > 0.6 and sigcorrs[a] <= 0.8:
        X,Y = m(clon[a],clat[a])  
        m.scatter(X,Y,s=200,label='Corr > 0.6')
    else:
        continue

for a in range(len(clat)):
    if sigcorrs[a] > 0.4 and sigcorrs[a] <= 0.6:
        X,Y = m(clon[a],clat[a])  
        m.scatter(X,Y,s=100,label='Corr > 0.4')
    else:
        continue

for a in range(len(clat)):
    if sigcorrs[a] <= 0.4:
        X,Y = m(clon[a],clat[a])  
        m.scatter(X,Y,s=50,label='Corr < 0.4')
    else:
        continue

plt.legend()
plt.show()
2个回答

7
您可以通过每个类别仅设置一个标签来避免此问题。 例如,在第一个循环中:
label_added =False
for a in range(len(clat)):
    if sigcorrs[a] > 0.8:
        X,Y = m(clon[a],clat[a])  
        if not label_added:
            m.scatter(X,Y,s=300,label='Corr > 0.8')
            label_added = True
        else:
            m.scatter(X,Y,s=300)
    else:
        continue

0
另一种方法是在for循环内部绘制没有标签的数据,并在for循环外部再次绘制最后一个索引数据的一个实例,并加上标签。例如:
错误的方式:
import numpy as np
import matplotlib.pyplot as plt
import matplotlib.colors

example_y1 = np.random.rand(100,1) * 1.2
example_y2 = np.random.rand(100,1)

x = range(len(example_y1))

for i in range(len(example1)):
    if example_y1[i] > example_y2[i]:
        plt.scatter(x[i],example_y1[i,0], c = 'blue', label='example1')
        plt.scatter(x[i],example_y1[i,0], c = 'green', label='example2')

plt.ylabel('Y')
plt.xlabel('X')
plt.legend(loc='upper left')
plt.show()

enter image description here

正确的方式:

import numpy as np
import matplotlib.pyplot as plt
import matplotlib.colors

example_y1 = np.random.rand(100,1) * 1.2
example_y2 = np.random.rand(100,1)

x = range(len(example_y1))

for i in range(len(example1)):
    if example_y1[i] > example_y2[i]:
        plt.scatter(x[i],example_y1[i,0], c = 'blue')
        plt.scatter(x[i],example_y1[i,0], c = 'green')
        n = i # last index

plt.scatter(x[n],example_y1[n,0], c = 'blue', label='example1')
plt.scatter(x[n],example_y1[n,0], c = 'green', label='example2')
plt.ylabel('Y')
plt.xlabel('X')
plt.legend(loc='upper left')
plt.show()

enter image description here


网页内容由stack overflow 提供, 点击上面的
可以查看英文原文,
原文链接