错误信息是一个有用的提示:JointGrid组织了几个子图,您需要找到特定的
ax进行绘制。
import numpy as np
import pandas as pd
import seaborn as sns
from matplotlib.pyplot import show
sns.set_style('darkgrid')
rs = np.random.RandomState(5)
mean = [0, 0]
cov = [[2, .1],
[.5, 3]]
y = np.random.multivariate_normal(mean, cov, 500, tol=1e-4)
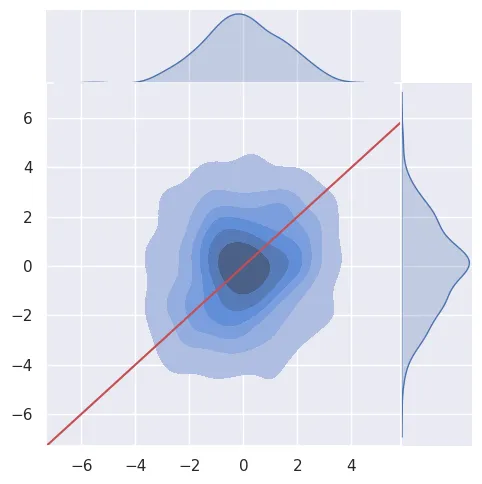
g = sns.jointplot(x=y[:,0], y=y[:,1],
kind="kde",
fill="true", height=5, space=0, levels=7)
x0, x1 = g.ax_joint.get_xlim()
y0, y1 = g.ax_joint.get_ylim()
lims = [max(x0, y0), min(x1, y1)]
g.ax_joint.plot(lims, lims, '-r')
show()
我在解释器中弄明白了这个问题:dir(g),然后 g.plot?,g.plot_joint? - 这些都是特定于 jointplot 的绘图函数 - 还有什么?- dir(g.ax_joint);啊哈,这里有 set_ylim 等。
对角线是 x=y 的直线,但请注意它不是中心图像像素的45度对角线。 Seaborn 的 jointplot 函数总是绘制一个正方形的中心图。当数据不对称时,图的 X 和 Y 轴会改变以适应正方形。变量 lims 保存显示边缘的数据坐标。
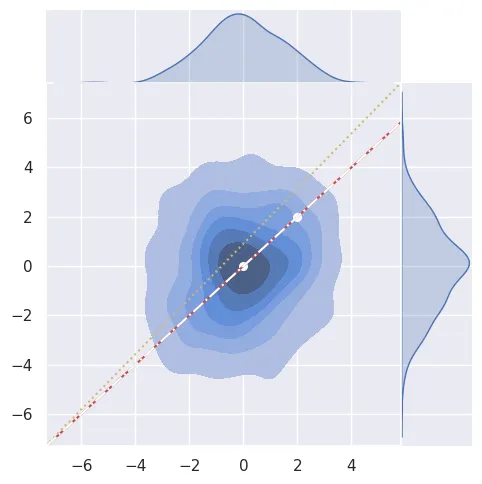
有一条评论建议绘制一条始终是显示对角线的对角线,但它不是数据平等的线。以下是几行代码添加到测试此并找出您想要哪个:
g.ax_joint.plot([0,1], [0,1], ':y', transform=g.ax_joint.transAxes)
g.ax_joint.plot(lims, lims, 'w', linestyle='dashdot', transform=g.ax_joint.transData)
g.ax_joint.scatter(x=[0, 2],y=[0,2], s=30,c= 'w',marker='o')
show()
g.ax_joint.plot([0, 1], [0, 1], ':k', transform=g.ax_joint.transAxes)。 - H4dr1en