我希望能够为每个变量单独设置边际图的颜色。
d1 = np.random.normal(10,1,100)
d2 = np.random.gamma(1,2,100)
col1 = sns.color_palette()[0]
col2 = sns.color_palette()[1]
col3 = sns.color_palette()[2]
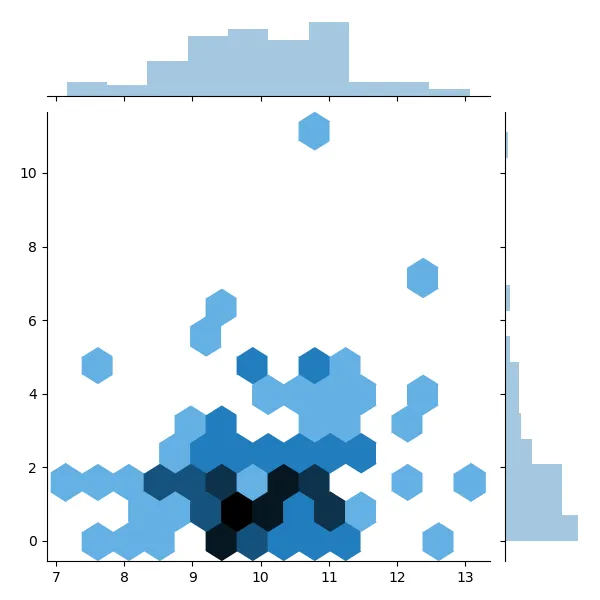
jp = sns.jointplot(d1, d2, kind="hex", annot_kws=dict(stat="r"), joint_kws=dict(bins='log'))
ax = jp.ax_joint
ax.plot(ax.get_xlim(), ax.get_ylim(), ls="--", c=".3", label="1:1")
输出结果:
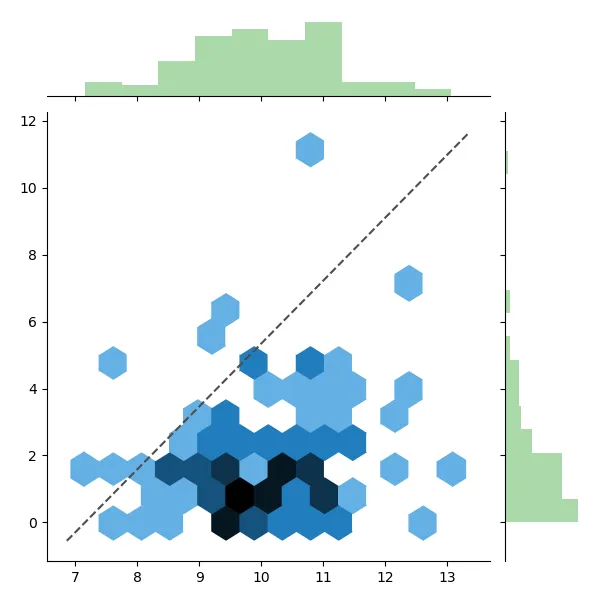
我想要分别为每个边缘图上色。但是当我为边缘轴分配参数时,它们会将相同的参数用于两个边缘图。
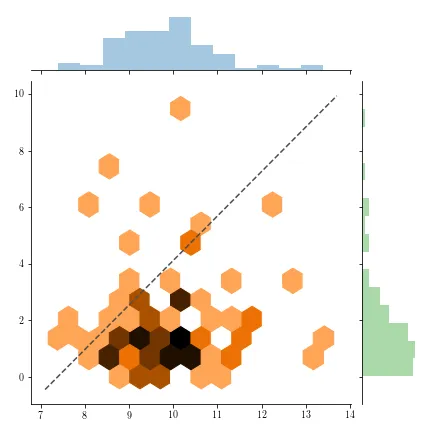
jp = sns.jointplot(d1, d2, kind="hex", annot_kws=dict(stat="r"), joint_kws=dict(bins='log'), marginal_kws=dict(hist_kws= {'color': col2}))
ax = jp.ax_joint
ax.plot(ax.get_xlim(), ax.get_ylim(), ls="--", c=".3", label="1:1")
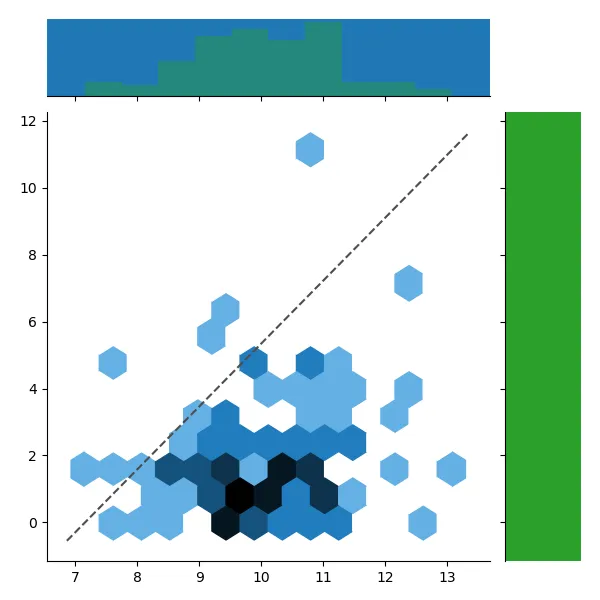
我可以为“facecolors”着色,但无法为轴本身着色。非常感谢任何帮助!
jp = sns.jointplot(d1, d2, kind="hex", annot_kws=dict(stat="r"), joint_kws=dict(bins='log'), marginal_kws=dict(hist_kws= {'color': col2}))
ax = jp.ax_joint
ax.plot(ax.get_xlim(), ax.get_ylim(), ls="--", c=".3", label="1:1")

# new code
jp.ax_marg_x.set_facecolor(col1)
jp.ax_marg_y.set_facecolor(col3)