R - 对 ggplot2 直方图的阴影部分进行着色

3

我有这些数据:

dataset     = rbinom(1000, 16, 0.5)
mean        = mean(dataset)
sd          = sd(dataset)
data_subset = subset(dataset, dataset >= (mean - 2*sd) & dataset <= (mean + 2*sd))

dataset     = data.frame(X=dataset)
data_subset = data.frame(X=data_subset)

这里是我如何绘制与 dataset 相关的直方图的方法:
ggplot(dataset, aes(x = X)) +
   geom_histogram(aes(y=..density..), binwidth=1, colour="black", fill="white") +
   theme_bw()
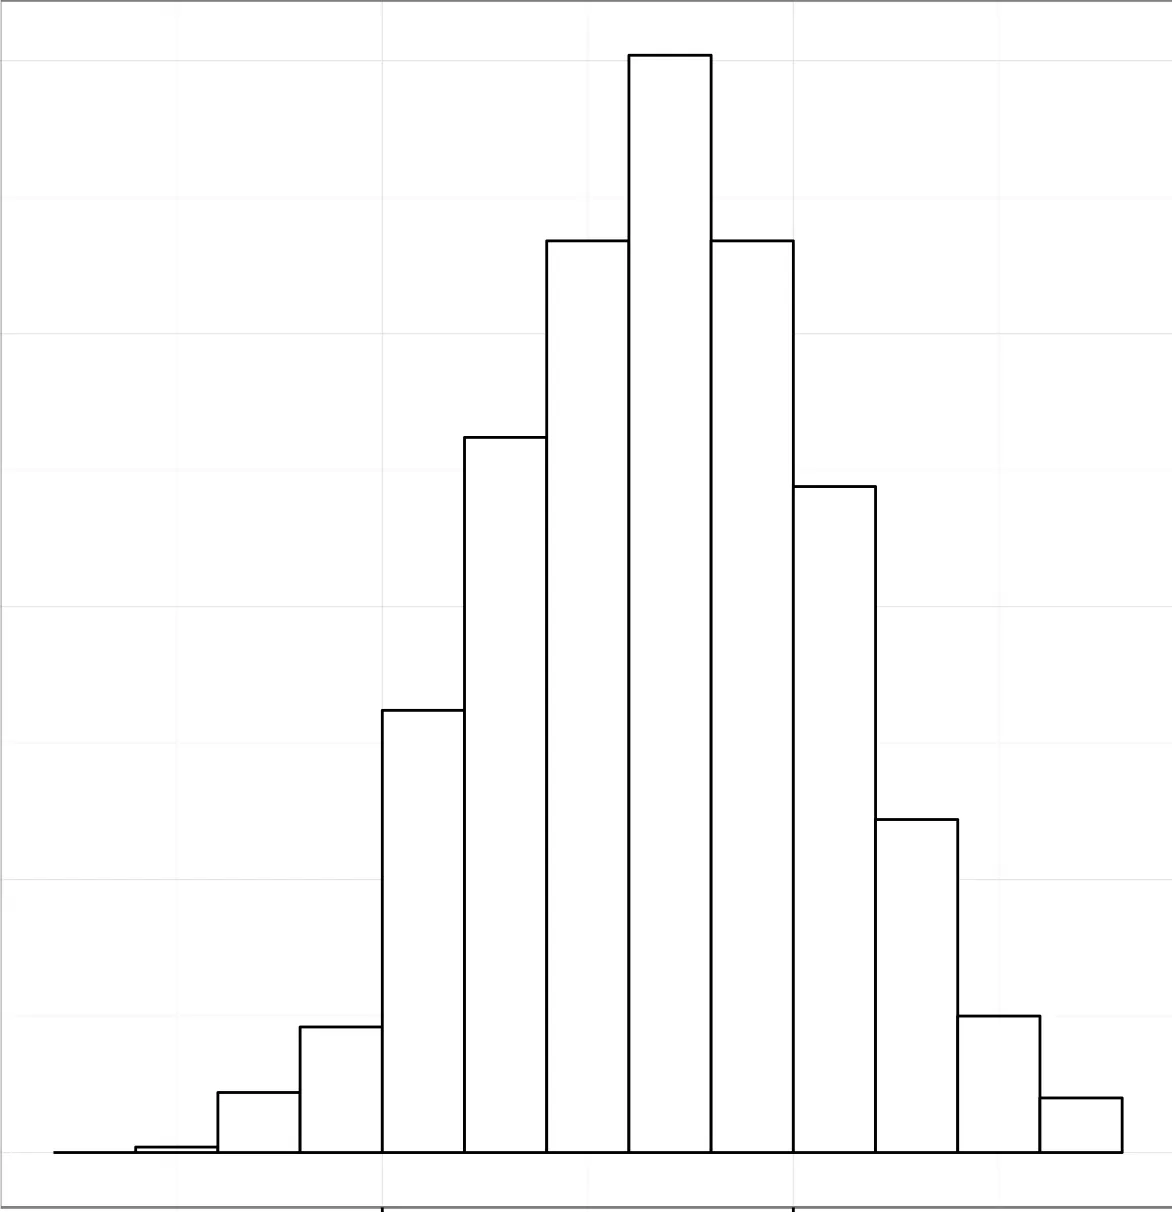
数据集

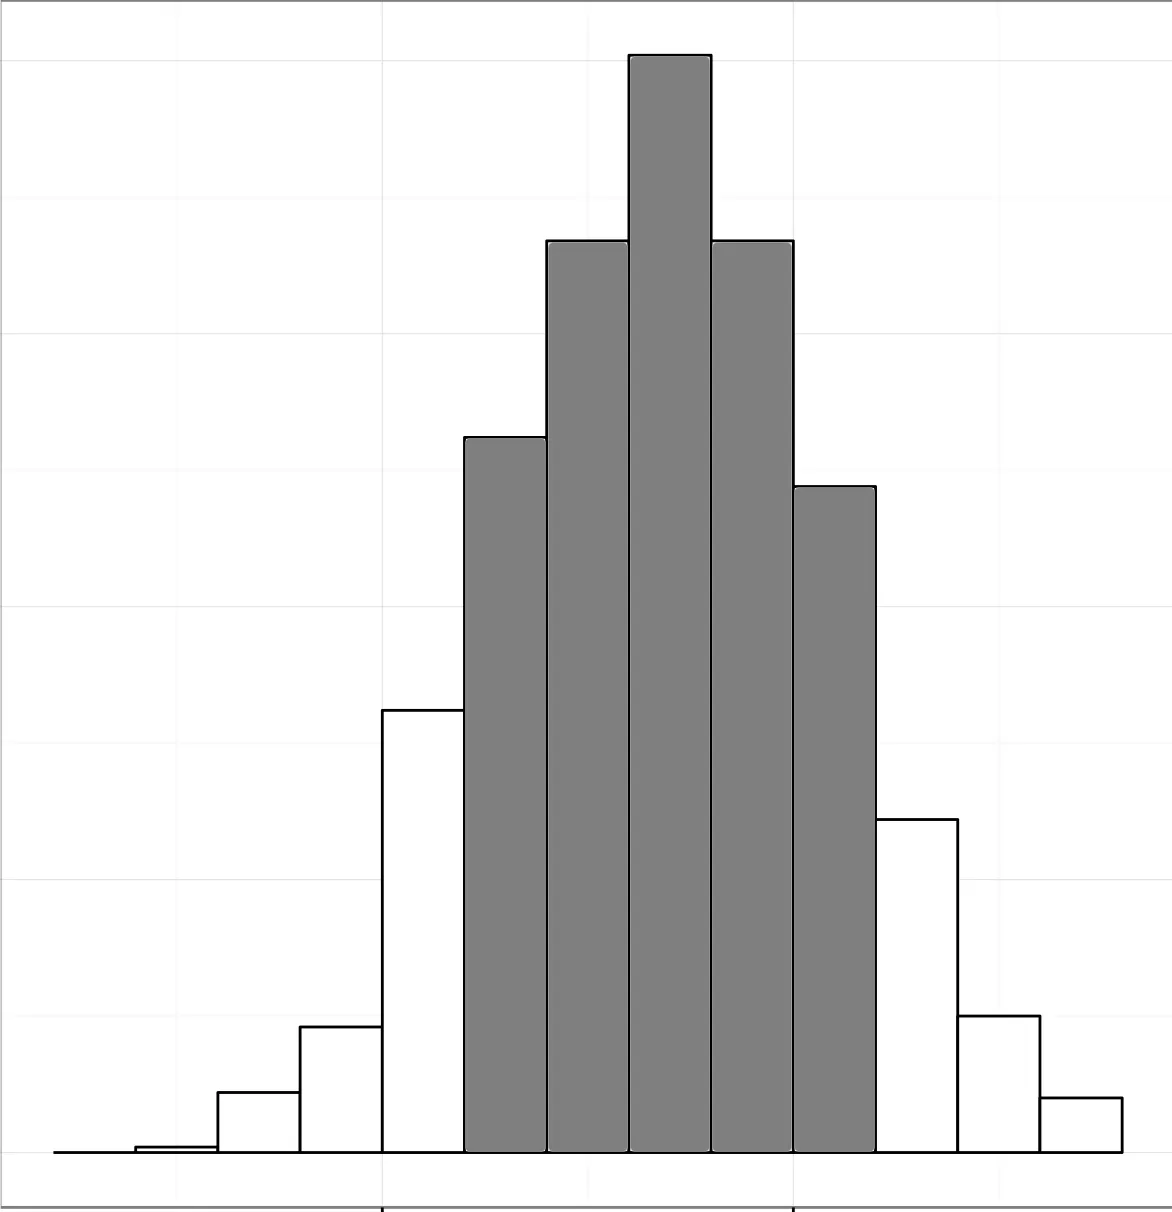
如何像这样对直方图的data_subset部分进行着色?

数据子集

2个回答

5

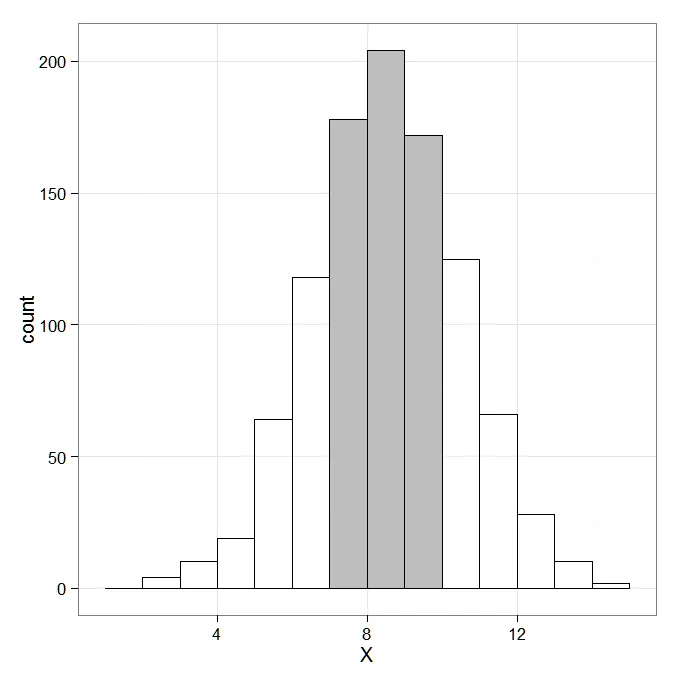
我的解决方案与joran的非常相似——我认为两者都值得关注,因为它们之间有一些细微的区别:

ggplot(dataset,aes(x=X)) +
   geom_histogram(binwidth=1,fill="white",color="black") +
   geom_histogram(data=subset(dataset,X>6&X<10),binwidth=1, 
   colour="black", fill="grey")+theme_bw() 

enter image description here


接受Joran的答案,因为他是第一个回答的。我希望我能够接受两个答案,抱歉! - surj
没问题(但你应该使用我的代码。 :-) aes继承,当你可以在ggplot中进行子集时,就不需要单独的数据框) - MattBagg

2

只需添加另一行geom_histogram,使用该数据子集(尽管您可能需要微调binwidth),如下:

ggplot(dataset, aes(x = X)) +
   geom_histogram(aes(y=..density..), binwidth=1, colour="black", fill="white") + 
   geom_histogram(data = data_subset,aes(y=..density..), binwidth=1, colour="black",fill = "grey") +
   theme_bw()

网页内容由stack overflow 提供, 点击上面的
可以查看英文原文,
原文链接