根据变量,对 sf LINESTRING 的颜色部分进行着色

3

我想使用变量在 ggplotgeom_sf 中为一个 sf LINESTRING 的不同部分涂上不同的颜色。我可以使用 geom_path 做类似的事情,但在 geom_sf 中似乎这种方法不起作用。有人能提供一种可能的方法吗?

示例数据

library(sf)
library(ggplot2)
library(dplyr)
library(tibble)


df <- tibble(time = seq(1,21),
             lon = seq(-50,-30, 1) + rnorm(n = 21),
             lat = seq(10, 20, 0.5) + rnorm(n = 21),
             type = c(rep('A',5),rep('B',10), rep('A',6)))

使用 tibble/dataframe:
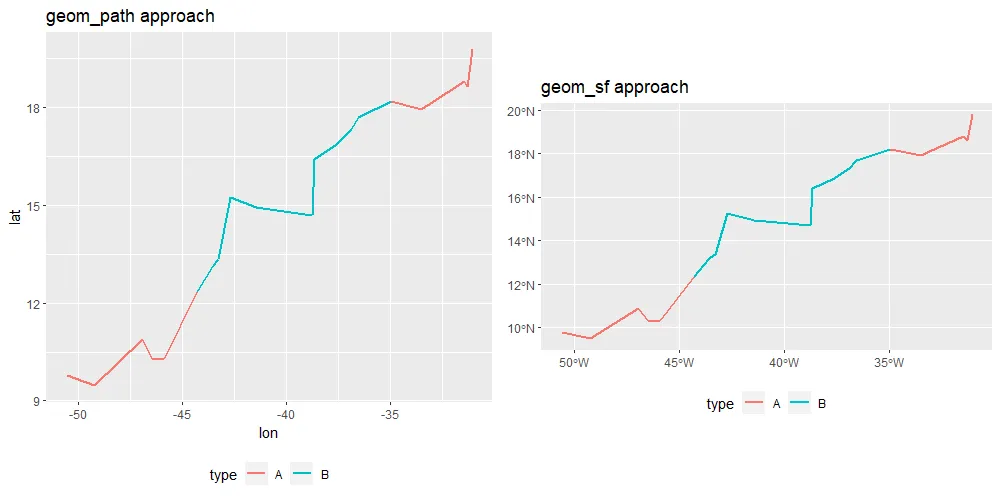
我可以使用一个 tibble 和基本的 ggplot 来做到这一点,加入 group = 1 并且单独绘制一条线,不同的部分用 type 呈现出不同的颜色。我想制作的就是这种类型的图形,但是使用一个 sf 对象来代替。

ggplot() +
  geom_path(data = df, 
            aes(lon, lat, color = type, group = 1))

使用sf对象/LINESTRING

如果我使用group_bytype将其转换为LINESTRING,那么最终会得到两个LINESTRING。

df_sf <- st_as_sf(df, coords = c('lon','lat')) %>%
  st_set_crs(.,value = 4326) %>%
  group_by(type) %>%
  summarize(do_union = TRUE) %>%
  st_cast(.,'LINESTRING')

当我对下面的代码进行变化时,最终结果会分成两行,并且类型为A的两个部分会连接在一起。

ggplot() +
  geom_sf(data = df_sf, 
            aes(color = type, group = 1))

有没有一种方法可以使用 geom_sf() 方法来实现类似于 ggplot + geom_path() 的行为(以便我可以投影变量等)?
1个回答

4

我在这里找到了一种把一行拆分成片段的方法,但对于您的使用情况可能有些过度。

尝试这个:

df_sf <- df %>%
  
  # ensure data is sorted along x-axis
  arrange(lon) %>%
  
  # detect each time type changes, & create a duplicate point with previous type
  mutate(change.type = tidyr::replace_na(lag(type) != type, FALSE)) %>%
  mutate(type = ifelse(change.type,
                       paste(lag(type), type, sep = ";"),
                       type) %>%
           strsplit(";")) %>%
  tidyr::unnest(cols = c(type)) %>%
  
  # create new group column that increments with every colour change
  mutate(change.type = tidyr::replace_na(lag(type) != type, FALSE)) %>%
  mutate(new.type = cumsum(change.type)) %>%
  
  st_as_sf(coords = c('lon', 'lat')) %>%
  st_set_crs(., value = 4326) %>%
  
  # group by both original type (for colour) & new type (for group)
  group_by(type, new.type) %>% 
  summarize(do_union = TRUE) %>%
  st_cast(.,'LINESTRING') %>%
  ungroup()

比较结果

cowplot::plot_grid(
  ggplot() +
    geom_path(data = arrange(df, lon), 
              aes(lon, lat, color = type, group = 1), size = 1) +
    ggtitle("geom_path approach") +
    theme(legend.position = "bottom"),
  
  ggplot() +
    geom_sf(data = df_sf, 
            aes(color = type, group = new.type), size = 1) +
    ggtitle("geom_sf approach") +
    theme(legend.position = "bottom"),

  nrow = 1
)

结果

数据:

set.seed(123)
df <- tibble(time = seq(1,21),
             lon = seq(-50,-30, 1) + rnorm(n = 21),
             lat = seq(10, 20, 0.5) + rnorm(n = 21),
             type = c(rep('A', 5), rep('B', 10), rep('A', 6)))

网页内容由stack overflow 提供, 点击上面的
可以查看英文原文,
原文链接