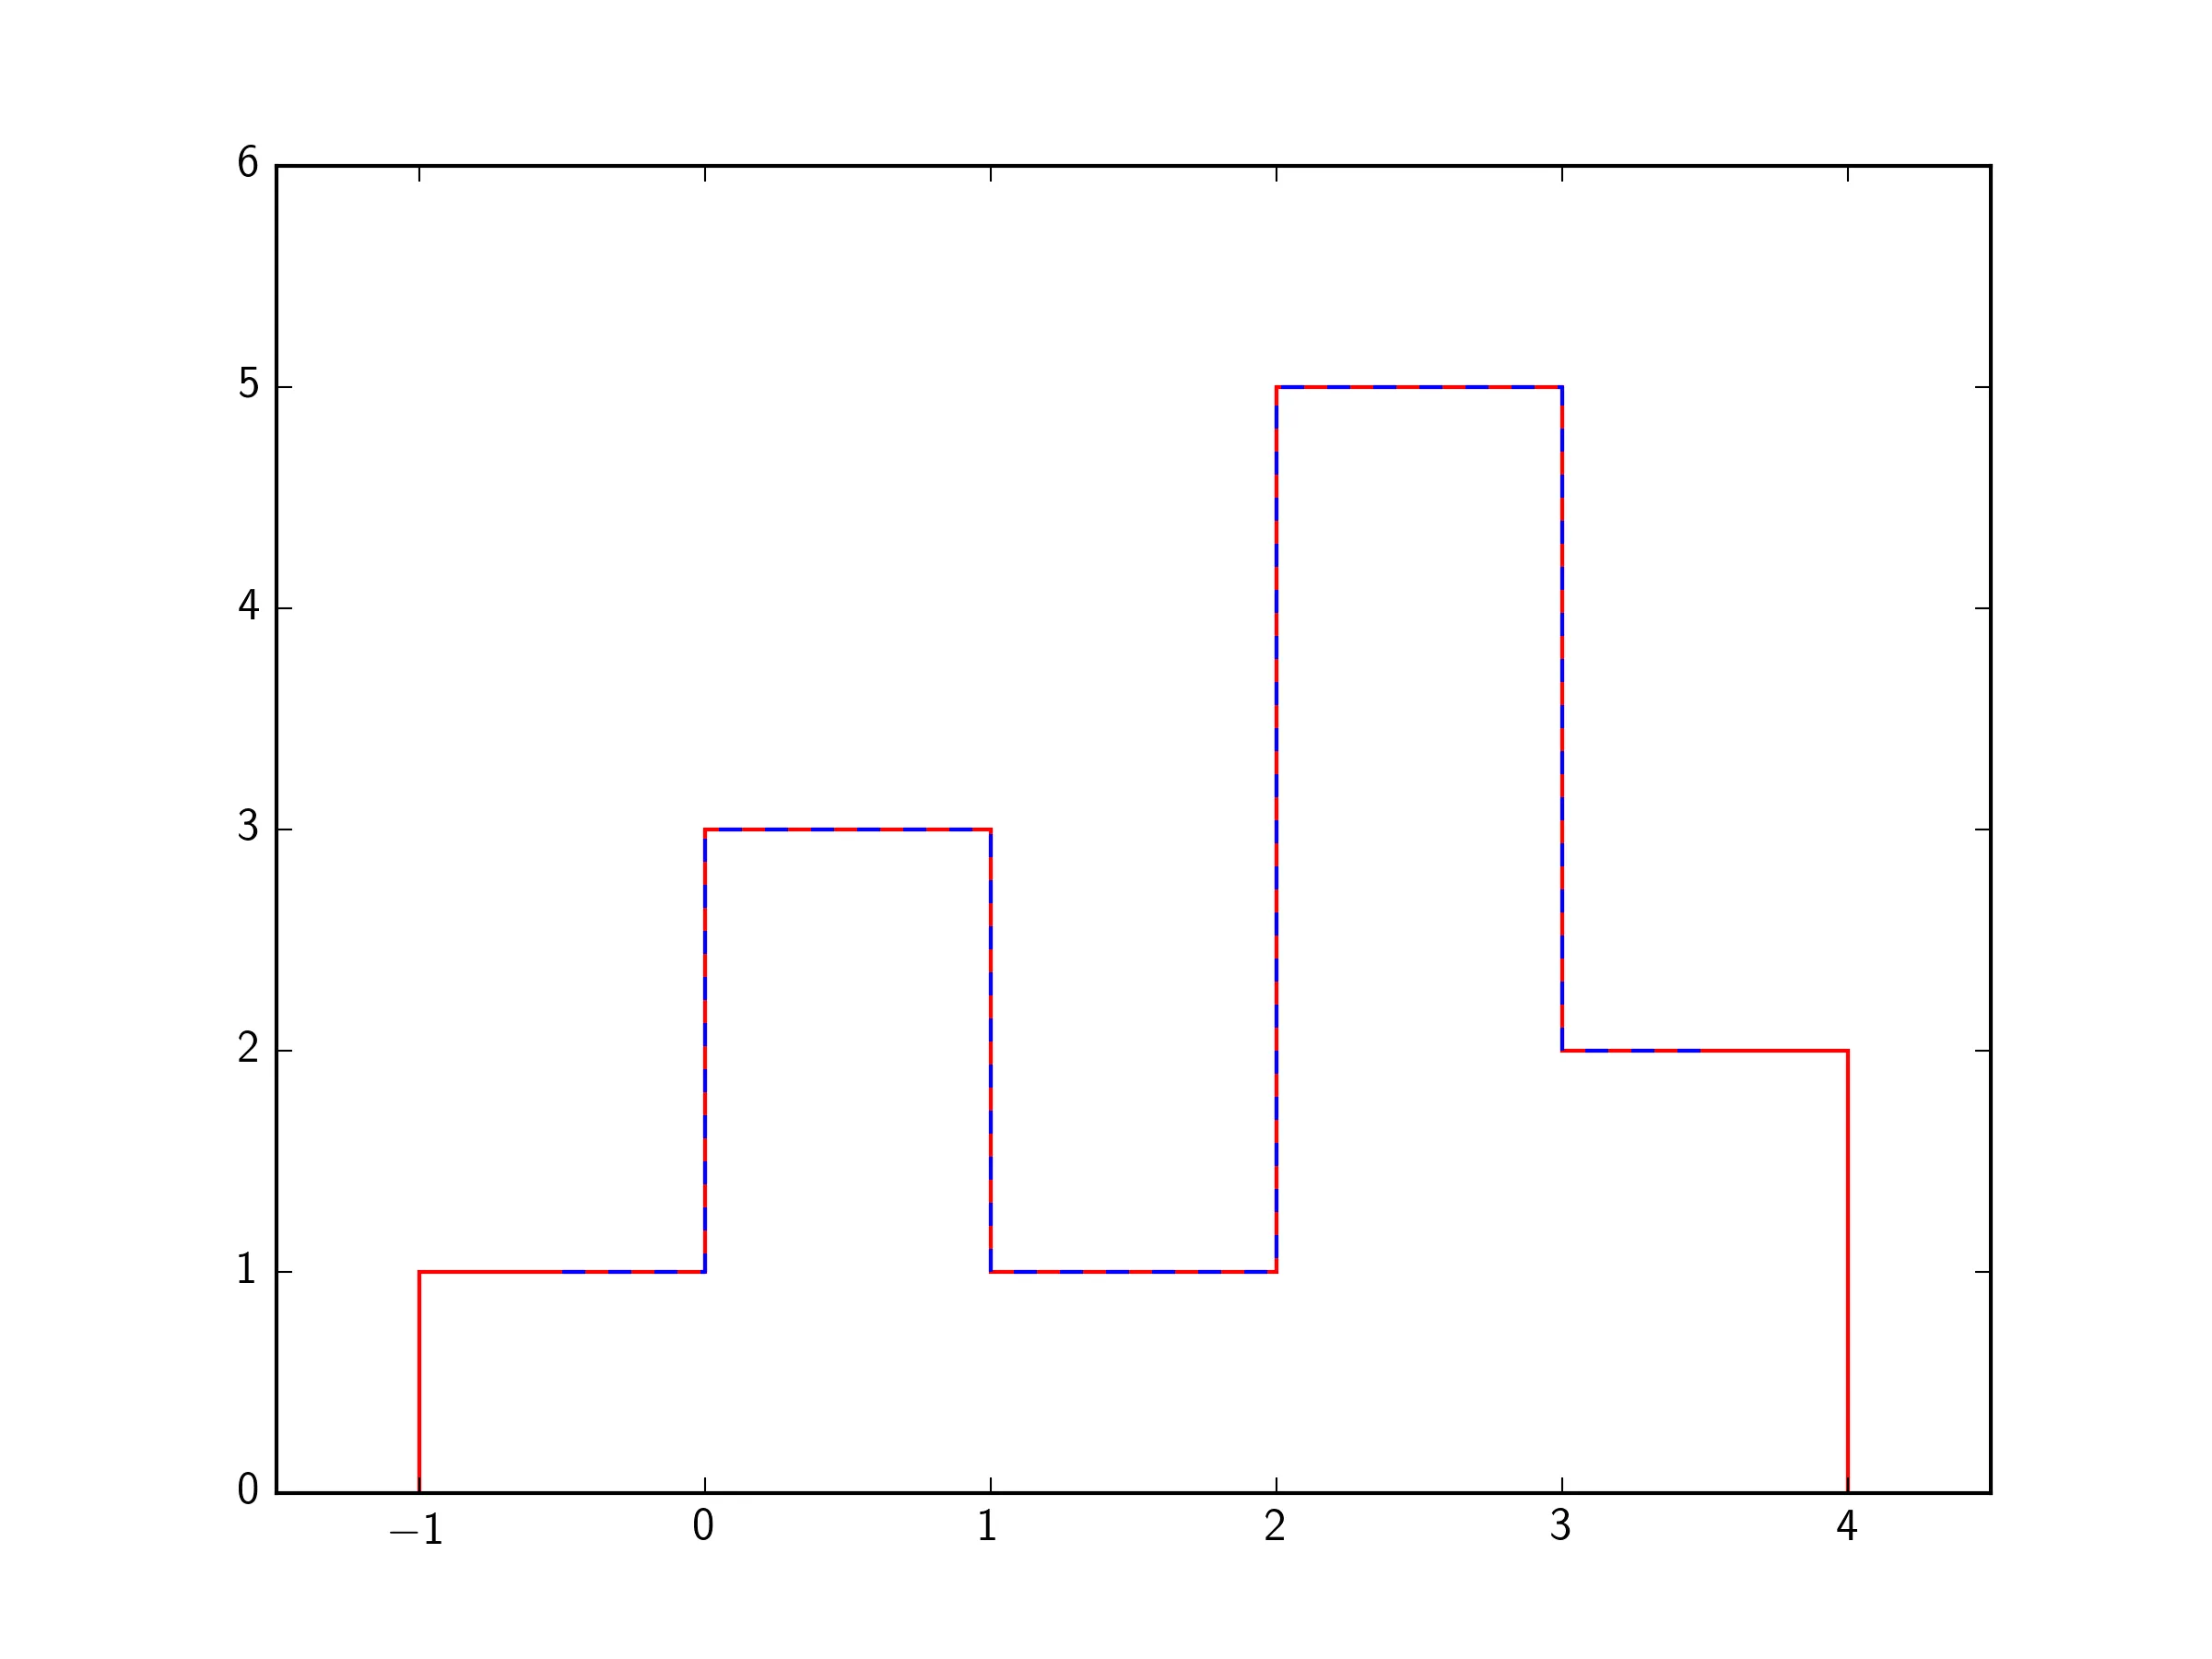
如何使用matplotlib绘制np.histogram的结果,类似于plt.hist

23

我喜欢将我的直方图绘制成这样:

data = [-0.5, 0.5, 0.5, 0.5, 
    1.5, 2.1, 2.2, 2.3, 2.4, 2.5, 3.1, 3.2]

plt.hist(data, bins=5, range=[-1, 4], histtype='step')

当我有一些比内存更大的输入数据时,我需要逐块填充直方图。例如:

H, bins = np.histogram([], bins=5, range=[-1, 4])
for data in a_lot_of_input_files:
    H += np.histogram(data, bins=5, range=[-1, 4])[0]

但问题始终是:“我该如何重新绘制这个H,使其看起来与以前的matplotlib版本完全相同。”

我想出的解决方案如下:

plt.plot(bins, np.insert(H, 0, H[0]), '-', drawstyle='steps')

两个不同版本的直方图绘制方式。

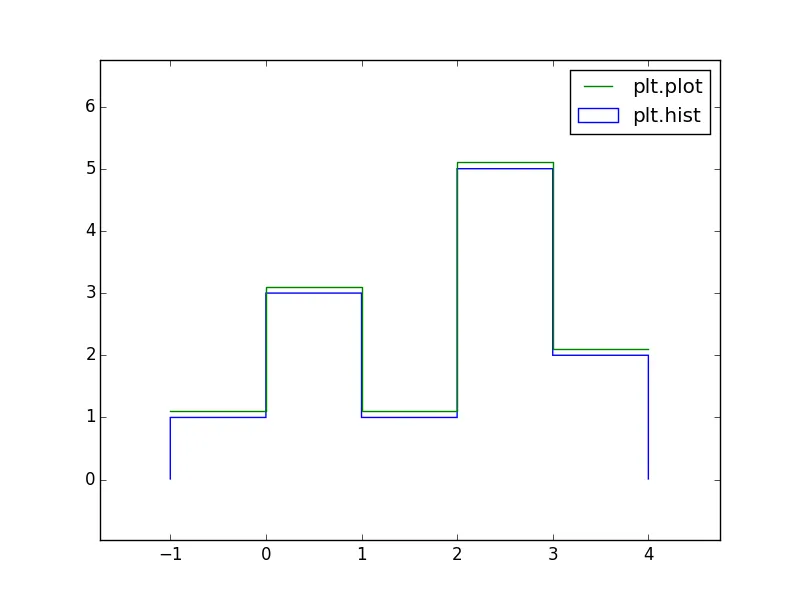
然而,两种结果看起来并不相同,而且为了绘制它而创建 H 的副本感觉也不太好。

有没有一些优雅的解决方案我所忽略的?(我还没有尝试使用 plt.bar,因为当我们想要比较直方图时,条形图显示效果并不好)
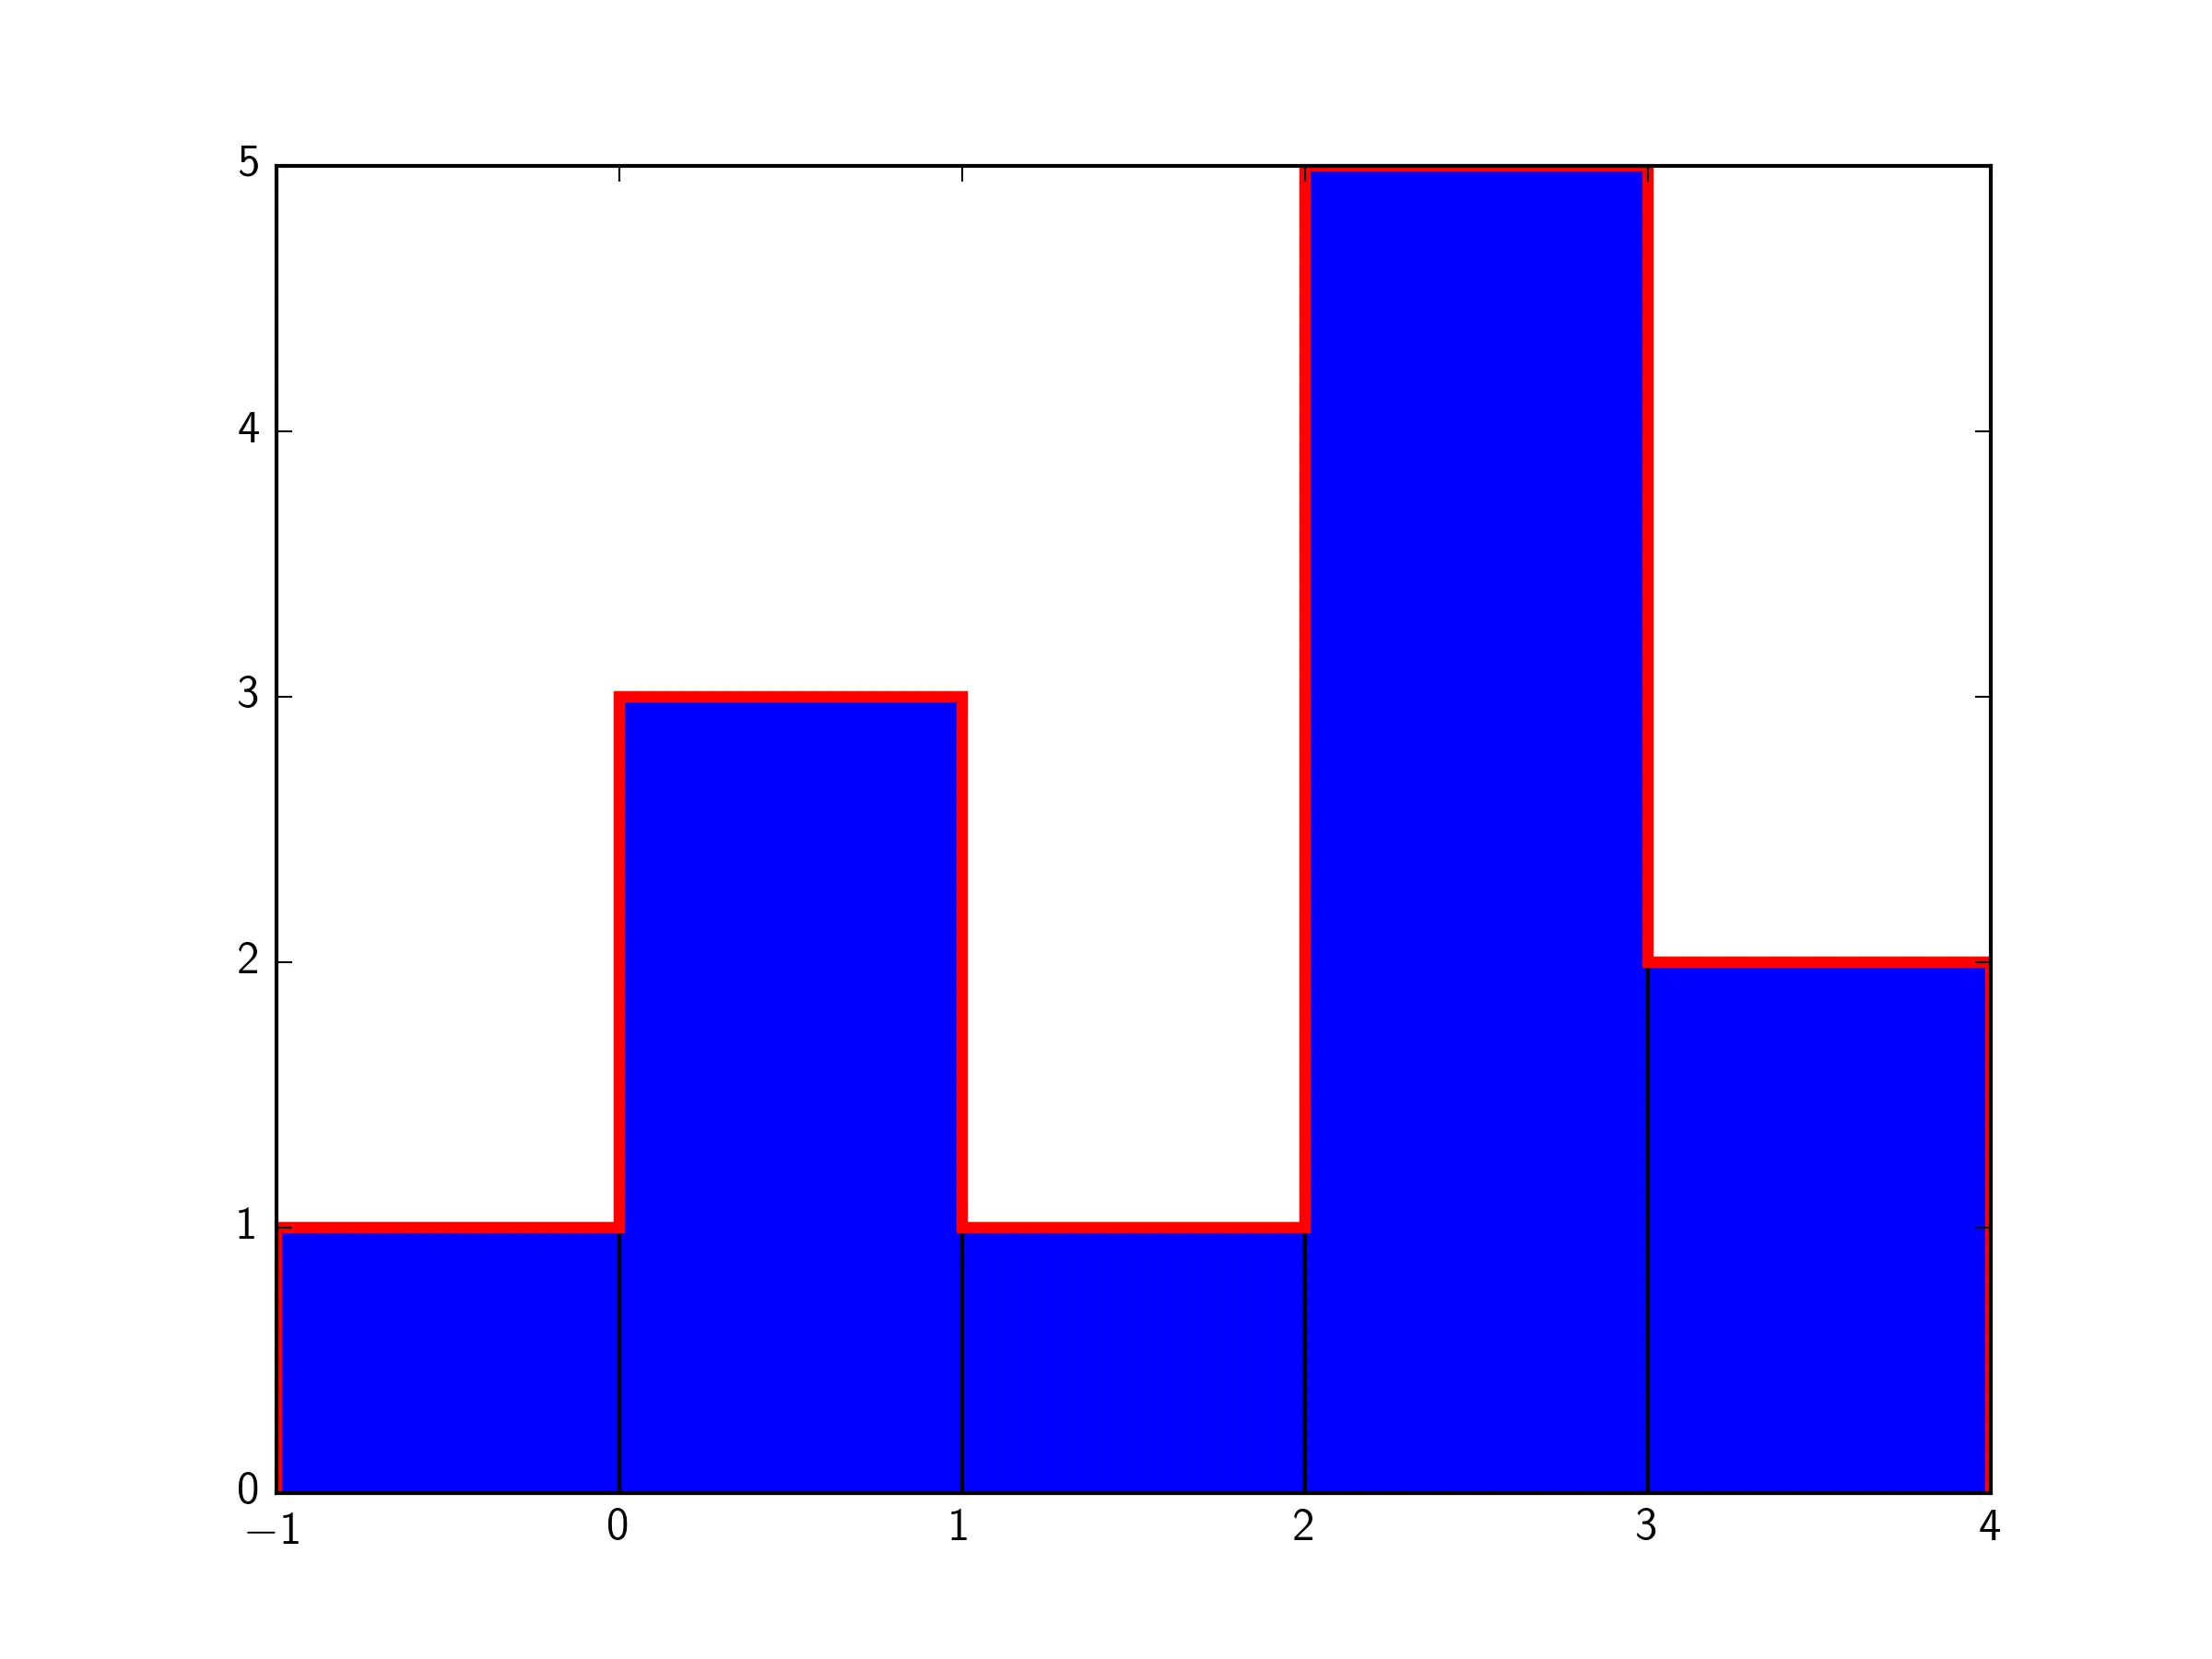

你尝试过使用堆叠条形图吗?你可以将单个直方图堆叠在一起,并给它们相同的面颜色,这样看起来就像一个单一的条形图...可以查看matplotlib的示例库 - jkalden
你可以通过查看plt.hist的源代码来取得一些进展:你会发现里面有很多逻辑,因此如果不复制这些逻辑,你很难精确地复制输出。 - jakevdp
使用plt.hist直接绘制直方图和使用plt.plot + np.histogram绘制应该产生相同的结果。np.histogram会给出非整数值,这似乎非常奇怪。为了避免复制数组,您可以省略bins的起始或结束值。 - DanHickstein
1
hist, bin_edges = np.histogram(data, range=(-1, 4), bins=5)
plt.bar(bin_edges[:-1], hist, width=np.diff(bin_edges), align='edge') plt.hist(data, range=(-1, 4), bins=5)
- Zaus
1个回答

15

我不确定你所说的“条形图在想要比较直方图时效果不好”的意思是什么,

解决这个问题的方法之一是使用plt.bar

import matplotlib.pyplot as plt
import numpy as np

data = [-0.5, 0.5, 0.5, 0.5, 
    1.5, 2.1, 2.2, 2.3, 2.4, 2.5, 3.1, 3.2]

plt.hist(data, bins=5, range=[-1, 4], histtype='step',edgecolor='r',linewidth=3)
H, bins = np.histogram(data[:6], bins=5, range=[-1, 4])
H+=np.histogram(data[6:], bins=5,range=[-1, 4])[0]

plt.bar(bins[:-1],H,width=1)

plt.show()

enter image description here

另外一种选择是plt.step:

import matplotlib.pyplot as plt
import numpy as np

data = [-0.5, 0.5, 0.5, 0.5, 
    1.5, 2.1, 2.2, 2.3, 2.4, 2.5, 3.1, 3.2]

plt.hist(data, bins=5, range=[-1, 4], histtype='step',edgecolor='r')
H, bins = np.histogram(data[:6], bins=5, range=[-1, 4])
H+=np.histogram(data[6:], bins=5,range=[-1, 4])[0]

bincentres = [(bins[i]+bins[i+1])/2. for i in range(len(bins)-1)]
plt.step(bincentres,H,where='mid',color='b',linestyle='--')

plt.ylim(0,6)

plt.show()

如果这对您是一个大问题,那么边缘可能不完全延伸到最远处,因此您可能需要在两端添加0-bin。

在此输入图像描述


是的,有一个解决方案(“不使用np.histogram”),但并不是针对所述问题的解决方案,即“如何条形图化np.histogram的输出”。 - codechimp
1
我从来没有说过不要使用np.histogram。事实上,我的两个解决方案都使用了它。因此,不确定你的评论意味着什么。 - tmdavison

网页内容由stack overflow 提供, 点击上面的
可以查看英文原文,
原文链接