这里是一个更长、更好的回答,包含更多数据:
import matplotlib.pyplot as plt
from numpy import concatenate
from sklearn.cluster import KMeans
from sklearn.feature_extraction.text import TfidfVectorizer
from sklearn.manifold import TSNE
train = [
'In 1917 a German Navy flight crashed at/near Off western Denmark with 18 aboard',
'In 1942 a Deutsche Lufthansa flight crashed at an unknown location with 4 aboard',
'In 1946 Trans Luxury Airlines flight 878 crashed at/near Moline, Illinois with 25 aboard',
'In 1947 a Slick Airways flight crashed at/near Hanksville, Utah with 3 aboard',
'There were 3 passenger/crew fatalities',
'In 1949 a Royal Canadian Air Force flight crashed at/near Near Bigstone Lake, Manitoba with 21 aboard',
'There were 21 passenger/crew fatalities',
'In 1952 a Airwork flight crashed at/near Off Trapani, Italy with 57 aboard',
'There were 7 passenger/crew fatalities',
'In 1963 a Aeroflot flight crashed at/near Near Leningrad, Russia with 52 aboard',
'In 1966 a Alaska Coastal Airlines flight crashed at/near Near Juneau, Alaska with 9 aboard',
'There were 9 passenger/crew fatalities',
'In 1986 a Air Taxi flight crashed at/near Frenchglen, Oregon with 6 aboard',
'There were 3 passenger/crew fatalities',
'In 1989 a Air Taxi flight crashed at/near Gold Beach, Oregon with 3 aboard',
'There were 18 passenger/crew fatalities',
'In 1990 a Republic of China Air Force flight crashed at/near Yunlin, Taiwan with 18 aboard',
'There were 10 passenger/crew fatalities',
'In 1992 a Servicios Aereos Santa Ana flight crashed at/near Colorado, Bolivia with 10 aboard',
'There were 44 passenger/crew fatalities',
'In 1994 Royal Air Maroc flight 630 crashed at/near Near Agadir, Morocco with 44 aboard',
'There were 10 passenger/crew fatalities',
'In 1995 Atlantic Southeast Airlines flight 529 crashed at/near Near Carrollton, GA with 29 aboard',
'There were 44 passenger/crew fatalities',
'In 1998 a Lumbini Airways flight crashed at/near Near Ghorepani, Nepal with 18 aboard',
'There were 18 passenger/crew fatalities',
'In 2004 a Venezuelan Air Force flight crashed at/near Near Maracay, Venezuela with 25 aboard',
'There were 25 passenger/crew fatalities',
]
vectorizer = TfidfVectorizer()
X = vectorizer.fit_transform(train)
n_clusters = 2
random_state = 1
clf = KMeans(n_clusters=n_clusters, random_state=random_state)
data = clf.fit(X)
centroids = clf.cluster_centers_
everything = concatenate((X.todense(), centroids))
tsne_init = 'pca'
tsne_perplexity = 20.0
tsne_early_exaggeration = 4.0
tsne_learning_rate = 10
model = TSNE(n_components=2, random_state=random_state, init=tsne_init,
perplexity=tsne_perplexity,
early_exaggeration=tsne_early_exaggeration, learning_rate=tsne_learning_rate)
transformed_everything = model.fit_transform(everything)
print(transformed_everything)
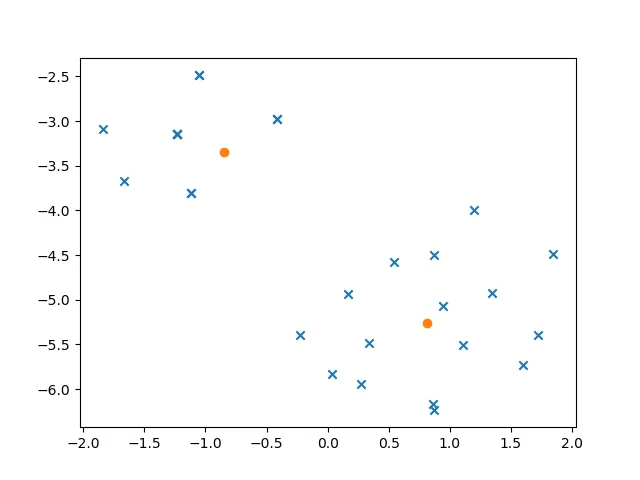
plt.scatter(transformed_everything[:-n_clusters, 0], transformed_everything[:-n_clusters, 1], marker='x')
plt.scatter(transformed_everything[-n_clusters:, 0], transformed_everything[-n_clusters:, 1], marker='o')
plt.show()
数据中有两个明显的聚类:一个是撞车描述,另一个是死亡人数总结。可以轻松注释掉行并微调聚类大小。按照编写的方式,代码应显示两个蓝色聚类,一个较大,一个较小,具有两个橙色质心。数据项比标记多:一些数据行被转换为空间中的相同点。最后,较小的t-SNE学习率似乎会产生更紧密的聚类。