将普通子图和Cartopy子图组合到同一幅图中

9
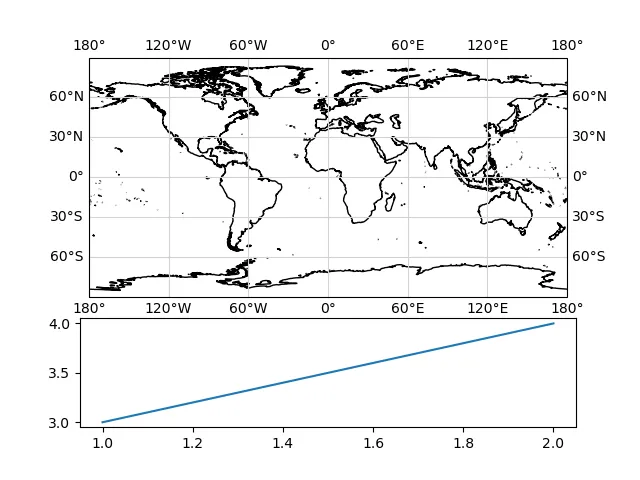
我想要一个具有两个子图的绘图,一个较大的带有地图,另一个较小的带有散点图。我使用cartopy来绘制地图。我使用gridspec_kw来确定高度的比例。然而,由于投影约束,它也会影响宽度。这是我得到的结果:
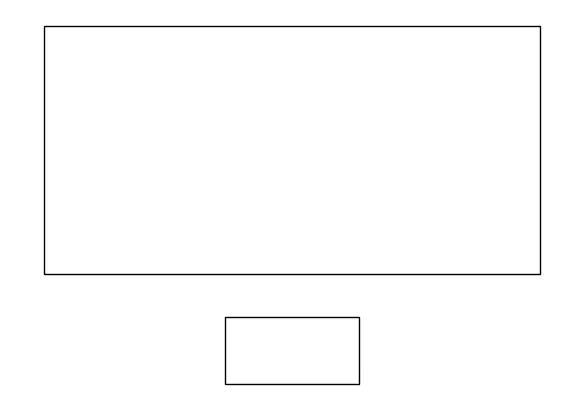
This is what i get
import matplotlib.pyplot as plt
import cartopy as ccrs
fig, ax = plt.subplots(2,1,subplot_kw=dict(projection=ccrs.crs.PlateCarree()),gridspec_kw={'height_ratios': [4, 1]})

一种可能的解决方案是仅对上面的面板使用subplot_kw=dict(projection=ccrs.crs.PlateCarree()。但我无法弄清楚如何做到这一点。有些方法推荐使用add_subplot,但那太麻烦了,我不喜欢这样做。是否可以使用plt.subplots()实现?
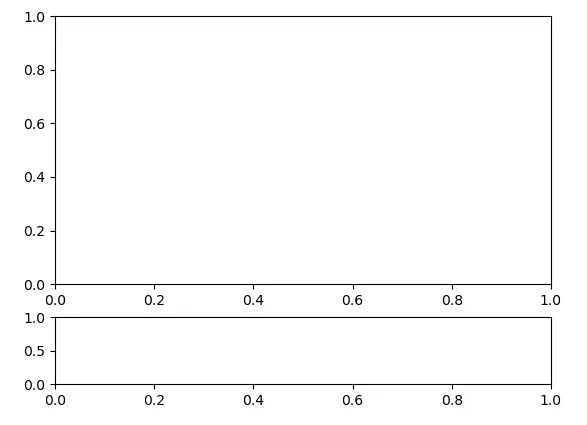
这就是我想要的 这就是我想要的。


2
不,你不能使用子图完成这个。 - Jody Klymak
你尝试过在Cartopy的ax上使用(0,0)位置和colspan=3,在散点图中使用(1,1)位置的(2,3)形状吗?matplotlib grispec和其他放置管理器 - david
1个回答

11

我的建议是使用gridspec来控制子图的大小,并使用fig.add_subplot代替plt.subplots。这样你就可以仅对第一个子图指定Cartopy投影。

import numpy as np
import matplotlib.pyplot as plt
import matplotlib.gridspec as gridspec
import cartopy.crs as ccrs
import cartopy.feature as cfeature

fig = plt.figure()
gs = fig.add_gridspec(3, 3)

ax1 = fig.add_subplot(gs[0:2, :], projection=ccrs.PlateCarree())
ax1.set_extent([-180, 180, -90, 90], crs=ccrs.PlateCarree())
ax1.coastlines(resolution='auto', color='k')
ax1.gridlines(color='lightgrey', linestyle='-', draw_labels=True)

ax2 = fig.add_subplot(gs[2, :])
ax2.plot([1, 2], [3, 4])

请输入图片描述


谢谢您的回答。这个方法可以实现,但不是我想要的。在循环中使用fig.add_subplot有点困难。我想要一个使用plt.subplots的答案。但我觉得这不可能,正如之前在评论中指出的那样。 - Vinod Kumar
NameError: name 'ax' is not defined - duff18
你是对的 @duff18,应该是 ax1.set_extent([-180, 180, -90, 90], crs=ccrs.PlateCarree()) 而不是 ax.set_extent([-180, 180, -90, 90], crs=ccrs.PlateCarree())。 现在已经修复了。 - Marcelo Andrioni
可以调整子图之间的距离吗? - Xue

网页内容由stack overflow 提供, 点击上面的
可以查看英文原文,
原文链接