在一个x*2的子图网格中,当子图共享x轴并以两个为一组时,是否可以将子图的标题放置在图形左侧?这些图形代表双向道路的交通计数。布局的想法如下图所示: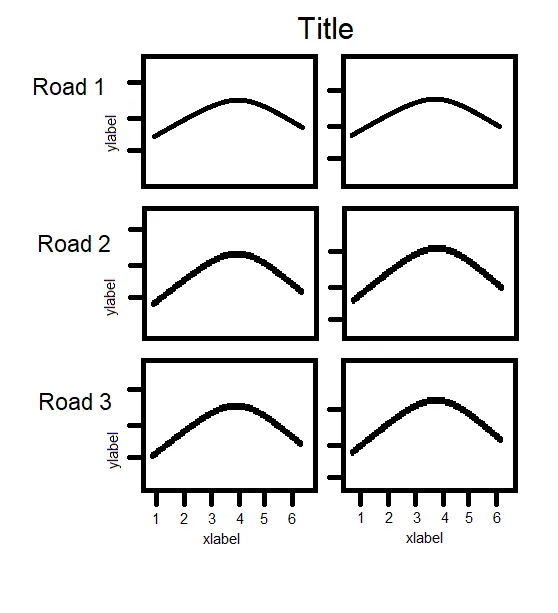 子图的排列方式如此处所示:这里。
子图的排列方式如此处所示:这里。import matplotlib.pyplot as plt
import numpy as np
# Simple data to display in various forms
x = np.linspace(0, 2 * np.pi, 400)
y = np.sin(x ** 2)
# row and column sharing
f, ((ax1, ax2), (ax3, ax4)) = plt.subplots(2, 2, sharex='col', sharey='row')
ax1.plot(x, y)
ax1.set_title('Sharing x per column, y per row')
ax2.scatter(x, y)
ax3.scatter(x, 2 * y ** 2 - 1, color='r')
ax4.plot(x, 2 * y ** 2 - 1, color='r')