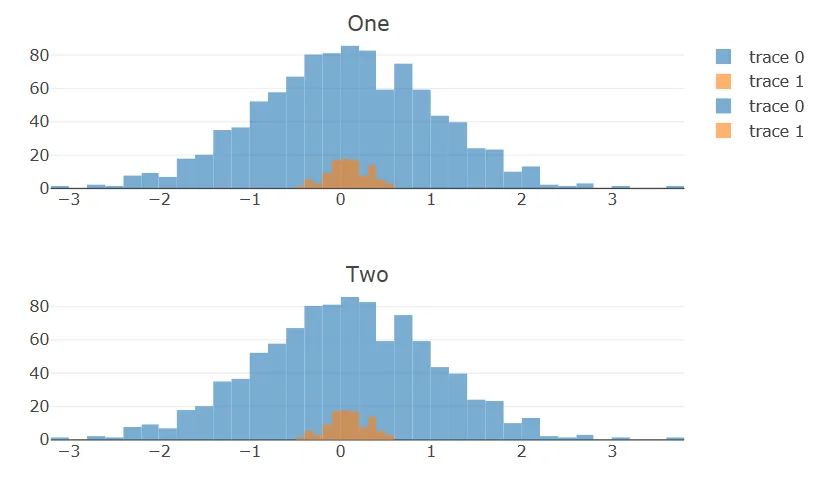
Plotly - 如何在一个图中复制相同的直方图

3
如何在下面的另一行上拥有相同的图表?
import plotly.offline as py
import plotly.graph_objs as go
import numpy as np

x0 = np.random.normal(loc=0, scale=1, size=1000)
x1 = np.random.normal(loc=0.1, scale=0.2, size=100)

trace0 = go.Histogram(
    x=x0
)
trace1 = go.Histogram(
    x=x1
)
data = [trace0, trace1]


layout = go.Layout(barmode='stack')
fig = go.Figure(data=data, layout=layout)

py.plot(fig, filename='stacked histogram')

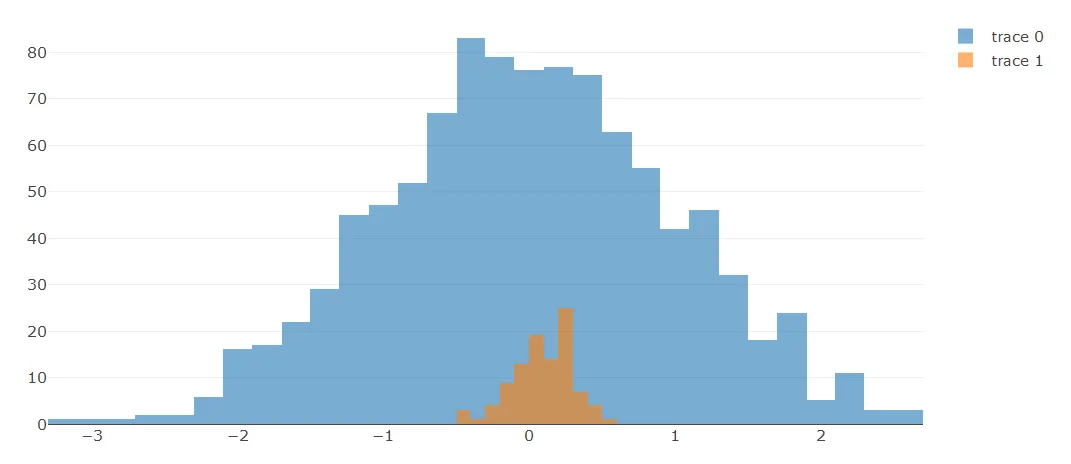
我想要从这里得到一个单一的直方图,放在同一张图中:

enter image description here

而现在需要将两个相同的直方图叠加在同一张图中,如下所示:

enter image description here

enter image description here


我发现你的问题有点混淆(同一情节三次),如果你想要一个重叠的直方图绘图,就像标题所述,那么我已经回答了 :) - byouness
1个回答

4

叠加图

只需将barmode = 'stack'替换为'overlay'。我将透明度设置为0.6,以便两个直方图都可见:

import plotly.offline as py
import plotly.graph_objs as go
import numpy as np

x0 = np.random.normal(loc=0, scale=1, size=1000)
x1 = np.random.normal(loc=0.1, scale=0.2, size=100)
trace0 = go.Histogram(
    x=x0,
    opacity=0.6
)
trace1 = go.Histogram(
    x=x1,
    opacity=0.6
)
data = [trace0, trace1]
layout = go.Layout(barmode='overlay')
fig = go.Figure(data=data, layout=layout)
py.plot(fig, filename='overlaid histogram')

这段代码会生成以下的图表:

enter image description here

子图

如果您想在一个2x1的网格中重复相同的图表,则可以使用Plotly的子图来实现:

import plotly.offline as py
import plotly.graph_objs as go
import numpy as np
from plotly import tools

x0 = np.random.normal(loc=0, scale=1, size=1000)
x1 = np.random.normal(loc=0.1, scale=0.2, size=100)
trace0 = go.Histogram(
    x=x0,
    opacity=0.6,
    name='trace 0',
    marker={'color':'#1f77b4'}
)
trace1 = go.Histogram(
    x=x1,
    opacity=0.6,
    name='trace 1',
    marker={'color':'#ff7f0e'}
)

fig2 = tools.make_subplots(rows=2, cols=1, subplot_titles=('One', 'Two'))
fig2.append_trace(trace0, 1, 1)
fig2.append_trace(trace1, 1, 1)
fig2.append_trace(trace0, 2, 1)
fig2.append_trace(trace1, 2, 1)

fig2.layout['barmode'] = 'overlay'
py.plot(fig2, filename='subplots')

你需要指定名称和颜色,以确保获得相同的图形。如果要在每个子图上堆叠或重叠直方图等内容,只需在图形布局中指定即可。例如,要获取重叠的直方图,请在上面使用fig2.layout['barmode'] = 'overlay'
这将给你以下结果:
请点击enter image description here查看图片。

抱歉,可能我没有解释清楚。我想要的是在两个不同的行上有相同的图形。 - Blue Moon
好的,在这种情况下,您可以使用子图,我已经编辑了上面的答案。 - byouness
需要重复绘制相同的图形。您只需分别绘制两个分布即可。我需要在两行上叠加两个图形。 - Blue Moon
啊,抱歉,我以为你想要每个跟踪数据都有一个图表......我再次编辑答案。使用Plotly的问题在于跟踪数据会被识别为不同的,所以图例中会有两个trace0、trace1。 - byouness

网页内容由stack overflow 提供, 点击上面的
可以查看英文原文,
原文链接