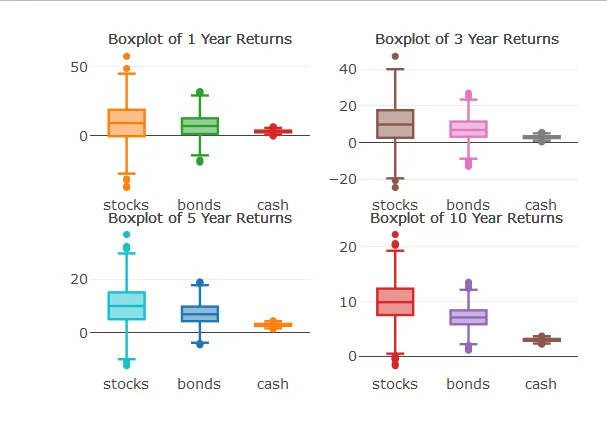
在下面的示例中,我在plotly subplot中有四个箱线图。这个例子中的每个箱线图都有3个变量:股票、债券和现金。在每个箱线图中,我希望股票显示为相同的颜色(例如蓝色),债券显示为相同的颜色(例如红色),现金显示为第三种颜色。我下面的代码导致我有12种颜色,而不是3种。我已经做了一个简单的例子。在我的实际问题中,变量的数量将在运行时确定,因此我不能轻松地硬编码颜色。我想调用一个调色板。
library(RColorBrewer)
library(plotly)
set.seed(101)
tbl1y <- data.frame(stocks = rnorm(1000,10,15),
                   bonds = rnorm(1000, 7, 8),
                   cash = rnorm(1000,3,1))
tbl3y <- data.frame(stocks = rnorm(1000,10,15*0.75),
                    bonds = rnorm(1000, 7, 8*0.75),
                    cash = rnorm(1000,3,1*0.75))
tbl5y <- data.frame(stocks = rnorm(1000,10,15*0.5),
                    bonds = rnorm(1000, 7, 8*0.5),
                    cash = rnorm(1000,3,1*0.5))
tbl10y <- data.frame(stocks = rnorm(1000,10,15*0.25),
                    bonds = rnorm(1000, 7, 8*0.25),
                    cash = rnorm(1000,3,1*0.25))

create_1boxplot <- function(tbl, n, vnames){
    mypalette <- brewer.pal(length(vnames), "Dark2")
    p <- plot_ly(data = tbl, type="box")
    for(i in vnames){
        p <- p %>%
            add_trace(y = tbl[,i], name = i)
    }
    a<-list(text=paste("Boxplot of", n, "Year Returns"),
            xref = "paper",
            yref = "paper",
            yanchor = "bottom",
            xanchor = "center",
            color = vnames,
            colors = mypalette,
            align = "left",
            valign = "top",
            x = 0.5,
            y = 1,
            showarrow = FALSE)
    p <- p %>% layout(annotations=a)
    return(p)
}

vnames <- c("stocks", "bonds", "cash")
p1 <- create_1boxplot(tbl1y, 1, vnames = vnames)
p3 <- create_1boxplot(tbl3y, 3, vnames = vnames)
p5 <- create_1boxplot(tbl5y, 5, vnames = vnames)
p10 <- create_1boxplot(tbl10y, 10, vnames = vnames)

subplot(p1, p3, p5, p10, titleX=FALSE, titleY=FALSE, nrows=2, margin=0.05) %>%
    layout(showlegend = FALSE,
           yaxis = list(title = ""),
           xaxis = list(title = ""))