我试图隐藏气泡图的x轴刻度。
我尝试在刻度属性中使用"display: false"。
它确实移除了刻度,但是图表现在被裁剪了。
有没有办法可以隐藏这些刻度而不影响图表的外观,或者可以添加一些填充,使图表的外观不受影响?
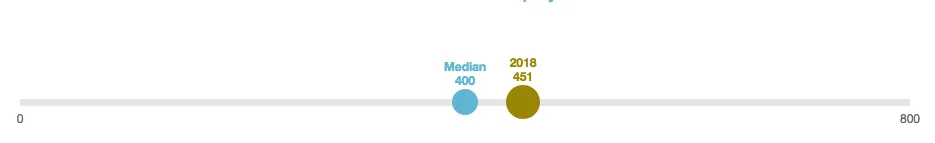
您可以在下面看到我创建的图表代码: 删除刻度之前的外观 删除"display:false"后的裁剪
我尝试在刻度属性中使用"display: false"。
它确实移除了刻度,但是图表现在被裁剪了。
有没有办法可以隐藏这些刻度而不影响图表的外观,或者可以添加一些填充,使图表的外观不受影响?
您可以在下面看到我创建的图表代码: 删除刻度之前的外观 删除"display:false"后的裁剪
xAxes : [
    {
        id : 'first-x-axis',
        ticks : {
            display : false,
            min :  <  ? php echo $min ?  > , // Controls where axis starts
            max :  <  ? php echo $max ?  > , // Controls where axis finishes
            stepSize :  <  ? php echo $step ?  > // Control the gap between the first x-axis value and the last x-axis value
        },
        gridLines : {
            display : false,
            lineWidth : 7 // Width of bottom line
        }
    }
]
我很感谢任何帮助或建议^_^