隐藏 dc.js 图表的 x 轴

9

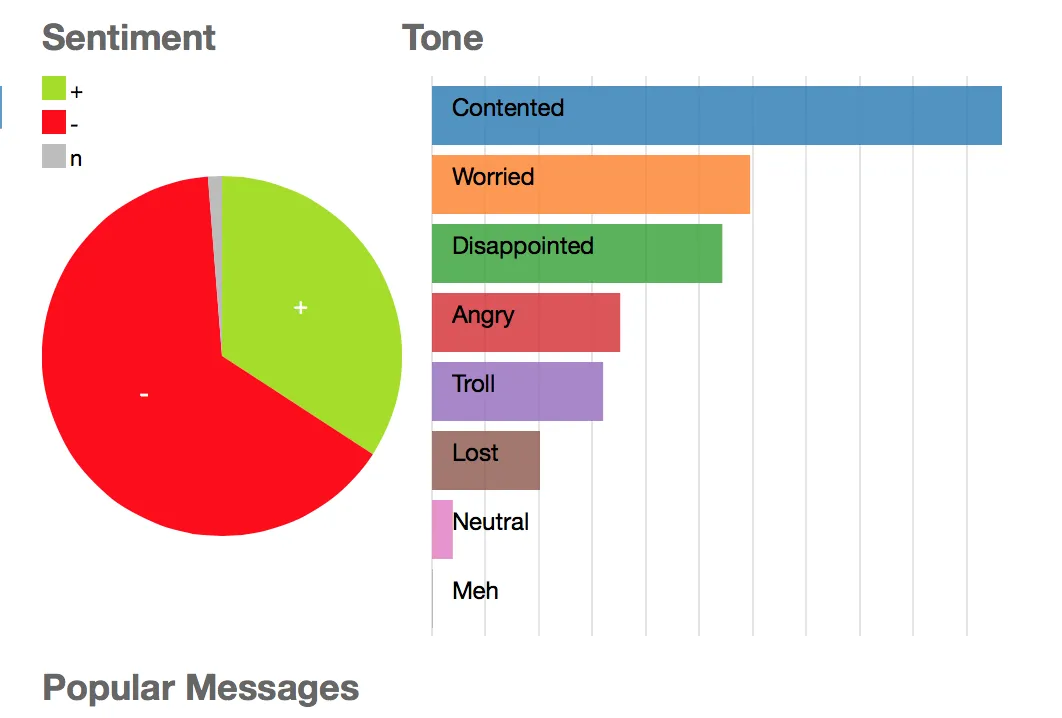
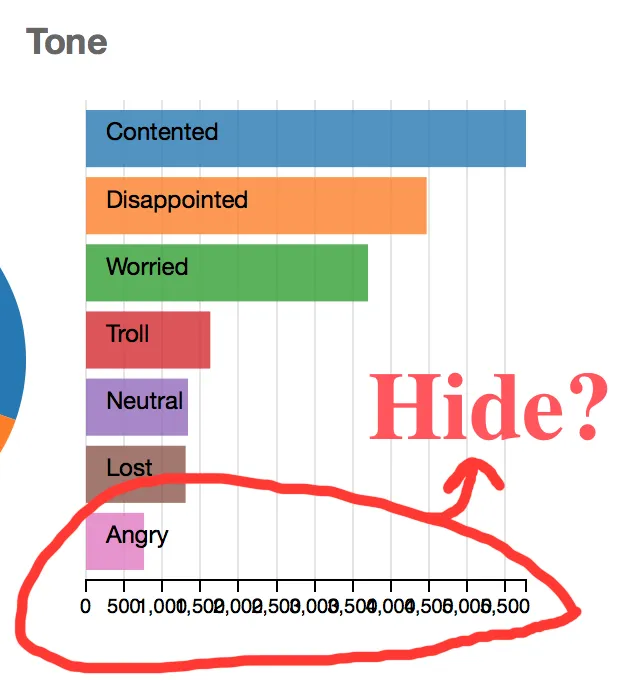
如下图所示,由于数据范围很大,x轴非常混乱。

我希望移除x轴,有什么好的方法吗?

隐藏dc.js图表x轴

我的当前代码:

toneChart.width(300).height(280)
    .dimension(tone)
    .group(toneGroup)
    .title(function (d) { return ""; })
    .ordering(function(d) { return - d.value })
    .cap(10)
    .transitionDuration(750)
    .renderLabel(true)
    .colors(d3.scale.category10())
    .elasticX(true);

谢谢!


你的意思是把它们转化成百分数吗?你能否也发布一个jsFiddle链接吗?这有助于获得高质量的回答。 - Chapo
嗨@Chapo,百分比太高了。现在我只需要移除a轴域并解决问题就可以了 :-) - Kai Feng Chew
7个回答

9

通过CSS,可以隐藏坐标轴和文本。

移除行图的X轴

在你的CSS中添加以下内容(替换#ID为你自己的ID):

#your-row-chart svg g g.axis.x { display: none; }

移除条形图的y轴

将以下内容添加到您的CSS中(将#ID替换为您自己的ID):

#your-bar-chart svg g g.axis.y { display: none; }

7
通过使用来自D3的.xAxis().tickFormat() 方法,您可以控制X轴上数值的格式。
// To format as a percent
chart.xAxis().tickFormat(function(v) { return 100 * v/yourDenominator + "%"; });

// To blank the the values entirely, though not the actual ticks marks themselves 
chart.xAxis().tickFormat(function(v) { return ""; });

这里有一个文档链接:

https://github.com/dc-js/dc.js/blob/master/web/docs/api-1.6.0.md#xaxisxaxis

在配置方法的传统堆栈之外,我发现最好这样做,因为如果您将.xAxis().tickFormat()与其他所有内容一起包含,则堆栈中的下一个方法当然将与.tickFormat()调用所发出的D3对象相关联,这可能导致令人烦恼的错误。

哇,这就是正确的方法。昨天我也在尝试自己解决这个问题,试图在.x()配置方法中使用比例尺,但是什么都没有改变。 - elsherbini

5
有趣!我刚解决了它!
提示:调整图表边距。虽然有点不规矩,但对我的情况来说很好用 :-P
.margins({top: 0, right: 0, bottom: -1, left: 0})

enter image description here


@ManojG 嗯希望能有所帮助刚刚发现我们有相同的兴趣,比如R和D3可视化 :-) - Kai Feng Chew
1
哈,是的。它帮助了我。而且我对数据科学中的R和D3可视化很感兴趣。很高兴看到我们有相同的兴趣 :-) - Manoj G

2

我也有同样的问题,关于y轴,这里有一种在库中实现它的方法:

  1. After the line var _yElasticity = false; add:

      var _yVisibility = true;
    
  2. After the declaration of _chart.elasticY = function (_) { ... } define a new function .showYAxis([boolean]) by adding:

    /**
    #### .showYAxis([boolean])
    Turn on/off y axis.
    **/
    _chart.showYAxis = function (_) {
        if (!arguments.length) {
            return _yVisibility;
        }
        _yVisibility = _;
        return _chart;
    };
    
  3. Change the condition that determines when the y-axis is rendered from

        if (_chart.elasticY() || render) {
            _chart.renderYAxis(_chart.g());
        }
    

to

        if ((_chart.elasticY() || render) && (_chart.showYAxis()) ) {
            _chart.renderYAxis(_chart.g());
        }

现在,您可以通过添加.showYAxis(false)来简单地删除图表中的y轴。

0

基于 @VictorCortes 的回答,这对我来说是最简单的方法。没有 CSS,也没有修改库。

根据图表类型使用 xAxisyAxis

toneChart.yAxis().tickFormat(function(v) {return "";});
toneChart.yAxis().ticks(0);

0

你可以尝试

toneChart.xAxis().ticks(0)

在你的 CSS 中(擦除轴)。
.toneChart .axis path, .axis line{
stroke: none;
}

0
这是一个可用的TypeScript解决方案。它搜索“axis x”类列表并隐藏xAxis元素。
public checkXAxisVisibility() {
        const elements = document.getElementsByClassName('axis x');
        if (elements && elements.length > 0) {
            const xAxis = elements[0] as HTMLElement;
            xAxis.style.display = this.chartHasData ? 'block ' : 'none';
        }
    }

网页内容由stack overflow 提供, 点击上面的
可以查看英文原文,
原文链接