Altair柱状图 - 标签位置和格式设置

3

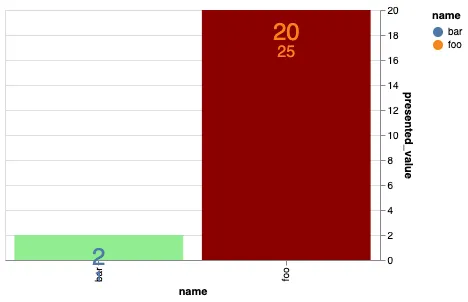
针对这个问题的跟进,我有两个额外的选项可供实现:

  1. 将标签放置于图表中间,无论柱形高度如何
  2. 将标签格式化为包括括号的字符串的一部分

我的代码目前看起来像这样:

df = pd.DataFrame({'name':['bar','foo'],
                  'presented_value':[2,20],
                  'coloring_value':[1,25]})

base = (alt.Chart(df, height=250, width=375).mark_bar()
 .encode(
    x='name',
    y=alt.Y('presented_value', axis=alt.Axis(orient='right')),
    color='name'
  )
)
bars = base.mark_bar().encode(color=alt.condition(
      alt.datum.presented_value > alt.datum.coloring_value,
      alt.value('lightgreen'),
      alt.value('darkred')
    ))

text_sub_brand = base.mark_text(
    align='center', baseline='bottom', 
    dy=35, fontSize=24
).encode(
    text='presented_value'
)
text_cluster = base.mark_text(
    align='center', baseline='bottom', 
    dy=50, fontSize=16
).encode(
    text='coloring_value'
).transform_calculate(label='"Cluster value: " + datum.coloring_value')


(bars + text_sub_brand + text_cluster).properties(width=700)

enter image description here

关于位置,我尝试使用这里的文档中不同的MarkDef参数,但没有找到允许相对于图表而非条形的放置选项。 
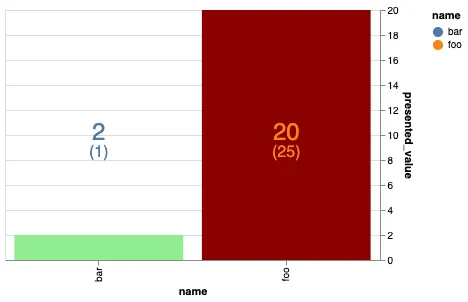
如上图所示,对于foo bar,我想避免标签出现在Y轴区域之外的情况。

关于格式方面,我尝试实现这里的解决方案,但由于某些原因在我的情况下没有起作用。 理想情况下,我希望格式为label='"(" + datum.coloring_value + ")"',但使用括号会导致JavaScript错误:

This usually means there's a typo in your chart specification. See the javascript console for the full traceback.

这可以做到吗?谢谢!

1个回答

6

您的文本有一个设置为presented_value的y编码,因此它将根据此显示在图表上。如果您想让它在图表上保持恒定位置,您可以将y编码设置为alt.value(pixels_from_top)

对于格式,您可以使用计算转换,然后在文本编码中引用此计算值。

组合起来,看起来像这样:

import altair as alt
import pandas as pd

df = pd.DataFrame({'name':['bar','foo'],
                  'presented_value':[2,20],
                  'coloring_value':[1,25]})

base = (alt.Chart(df, height=250, width=375).mark_bar()
 .encode(
    x='name',
    y=alt.Y('presented_value', axis=alt.Axis(orient='right')),
    color='name'
  )
)
bars = base.mark_bar().encode(color=alt.condition(
      alt.datum.presented_value > alt.datum.coloring_value,
      alt.value('lightgreen'),
      alt.value('darkred')
    ))

text_sub_brand = base.mark_text(
    align='center', baseline='bottom', 
    dy=35, fontSize=24
).encode(
    y=alt.value(100),
    text='presented_value'
)
text_cluster = base.mark_text(
    align='center', baseline='bottom', 
    dy=50, fontSize=16
).encode(
    y=alt.value(100),
    text='label:N'
).transform_calculate(label='"(" + datum.coloring_value + ")"')


(bars + text_sub_brand + text_cluster).properties(width=700)

enter image description here


网页内容由stack overflow 提供, 点击上面的
可以查看英文原文,
原文链接