GNUPLOT:在球面上绘图

5

我有一个依赖于phi和theta的函数,我想在球面上绘制它。 日期存储在一个.txt文件中,其中包含以下列:

1: x = R*sin(theta)*cos(phi)
2: y = R*sin(theta)*sin(phi)
3: z = R*cos(theta)
4: density

I use the following gnuplot code to plot:

set terminal wxt size 800,800
set mapping cartesian
set view equal xyz
set xlabel 'x'
set ylabel 'y'
set zlabel 'z'
splot "densityprofile_100.000.txt" u 1:2:3:4 with pm3d
pause -1

不幸的是,Gnuplot似乎无法正确表示球体上的颜色。似乎有一些阴影,我无法去掉它,可以参考这里的图片:

enter image description here

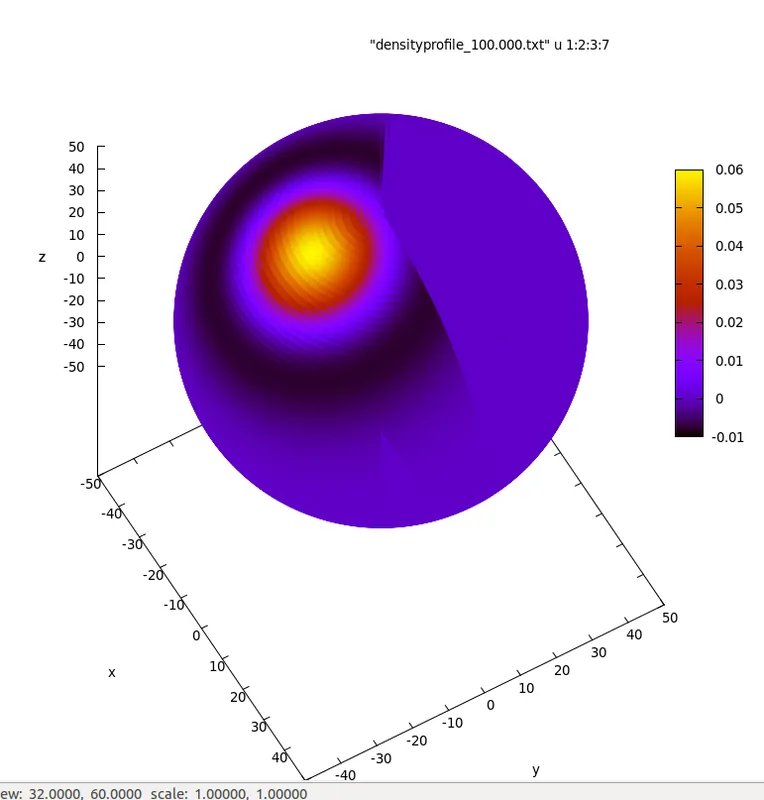
当我用鼠标旋转球体时,阴影会变小或变大,但没有一个位置使其完全消失。任何帮助都将不胜感激。


请将图像上传到某个地方并发布链接。然后有更高声誉的人可以帮助您添加它。同时,请提供数据文件,以便重现/测试/修复您的问题。 - Christoph
一个猜测:尝试使用 set autoscale cbfix,这样颜色范围仅跨越您数据文件中确切的值。 - Christoph
好的,我已将图像添加为内嵌。请问您能否将数据文件上传至某处?如果没有数据文件,我无法检查出问题所在。 - Christoph
找到解决方案了。如果数据文件对用户仍然有用,请告诉我,我会尝试上传它。 - Klamauk
2个回答

5

我通过添加以下一行代码找到了解决问题的方法:

set pm3d depthorder

1

我猜测可能是深度排序导致了一些问题。您尝试过使用pm3d的“hidden3d”选项吗?

来自gnuplot关于pm3d的帮助:

The option hidden3d takes as the argument a linestyle which must be created by set style line .... (The style need not to be present when setting pm3d, but it must be present when plotting). If set, lines are drawn using the specified line style, taking into account hidden line removal. This is by far more efficient than using the command set hidden3d as it doesn't really calculate hidden line removal, but just draws the filled polygons in the correct order. So the recommended choice when using pm3d is

 set pm3d at s hidden3d 100
 set style line 100 lt 5 lw 0.5
 unset hidden3d
 unset surf
 splot x*x+y*y

网页内容由stack overflow 提供, 点击上面的
可以查看英文原文,
原文链接