我从C ++函数中获得一系列球体的中心坐标(半径为r)。我想用gnuplot绘制这个链。如何用真实半径表示球体? 此解决方案实际上不起作用,因为pointsize的单位与轴的单位不同(并且随着轴限制而改变)。
1个回答
5
这是一种略带不规范的解决方案,它使用了参数化(以及来自Unix的某些命令)。对于以下数据的每一行,我们将绘制一个半径为r,以(x,y,z)为中心的球体:
# points.dat :
# x y z radius
0 0 0 0.5
1 2 2 1.0
3 4 5 0.7
2 5 7 1.0
1 3 4 0.75
2 0 1 1.5
换句话说,我们将使用形式为的命令运行:
splot x1+r1*cos(v)*cos(u), y1+r1*cos(v)*sin(u), z1+r1*sin(v) title "line 1",\
      x2+r2*cos(v)*cos(u), y2+r2*cos(v)*sin(u), z2+r2*sin(v) title "line 2", ...
下面的代码将起到作用(通过脚本中的注释):
set view equal xyz           # to scale the axes of the plot
set hidden3d front           # draw opaque spheres
set parametric               # enable parametric mode with angles (u,v)
set urange [0:2*pi]
set vrange [-pi/2.0:pi/2.0]

filename = 'spheres.dat'

# get number of data-lines in filename
nlines   = system(sprintf('grep -v ^# %s | wc -l', filename))

# this will save the plot commands
commands = 'splot '
do for [i=1:nlines] {
   # get the i-th line
   line = system( sprintf('grep -v ^# %s | awk "NR == %i {print; exit}" ', filename, i) )

   # extract the data
   x = word(line,1)
   y = word(line,2)
   z = word(line,3)
   r = word(line,4)

   # and save the instructions to plot the corresponding sphere
   commands = commands . sprintf('%s + %s*cos(v)*cos(u), %s + %s*cos(v)*sin(u), %s + %s*sin(v)  t "line %i"', x, r, y, r, z, r, i)

   # if not EOF, add a comma to commands
   if(i<nlines) { commands = commands . ',  ' }
}

# commands is a string. We can run it into the command line through macros
set macros
@commands
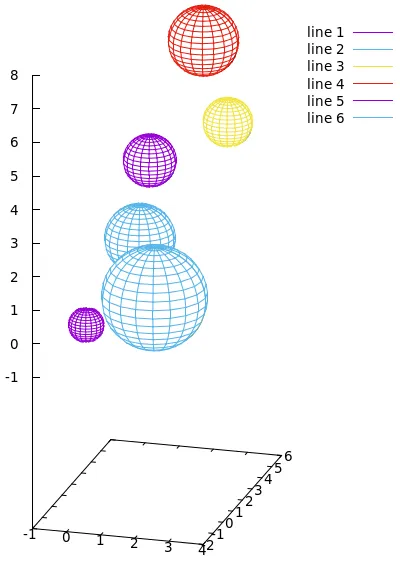
这是我获得的输出结果:
- vagoberto
网页内容由stack overflow 提供, 点击上面的可以查看英文原文,
原文链接
原文链接