将数据导入到gnuplot脚本并绘制图形

39

我想创建一个包含三个图形的gnuplot图表。数据应该是内联的(因为我只想要)。
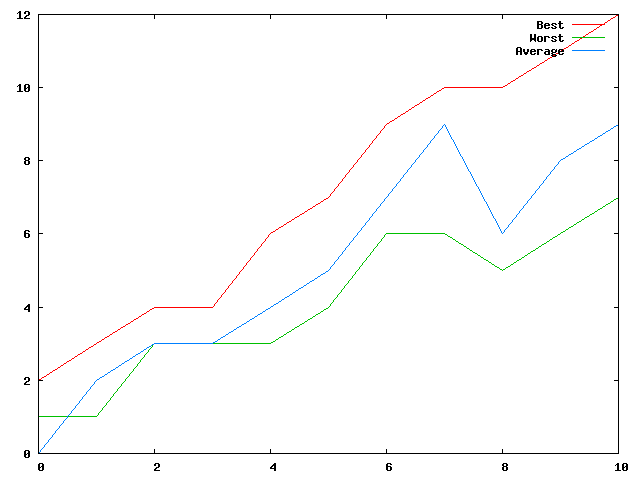
它应该看起来像这样:

https://s22.postimg.cc/qcc94e1i9/test.png

目前,我正在使用以下gnuplot脚本创建绘图:

set terminal png
set output "test.png"
plot for[col=2:4] "data.txt" using 1:col title columnheader(col) with lines

文件data.txt内容为:

Generation Best Worst Average
0 2 1 0
1 3 1 2
2 4 3 3
3 4 3 3
4 6 3 4
5 7 4 5
6 9 6 7
7 10 6 9
8 10 5 6
9 11 6 8
10 12 7 9

我想将 data.txt 导入 gnuplot,而不依赖于脚本中引用的数据文件。 类似这样 cat data.txt | gnuplot plot.gnu。 原因是我有多个 data.txt 文件,并不想为每个文件建立一个 plot.gnu 文件。

我在这个stackoverflow帖子中读到了特殊的'-'文件,并且我还读到了一个文件中包含多个图表的方法。然而,这将需要将数据包含在gnuplot代码中,这并不干净。


可以肯定的是,你用基于群体的算法解决了一些优化问题 ;) - John_West
6个回答

32

如果您使用的是 Unix 系统(即不是 Windows),您可以使用 '<cat' 而非 '-' 来读取标准输入:

plot '<cat' using ...

那么您可以执行 cat data.txt | gnuplot script.gp。然而,在你的问题中提到的特定情况中,由于在 for 循环中进行了绘图,您需要三次读取输入数据。因此,通过 stdin 发送数据并不适用,因为数据在第一次读取后就会消失。


28

虽然这不是一个直接的答案,但这是我用来快速查看数据的方法。使用 cut 命令特别有帮助。

cat data.txt | cut -f2 -d' ' | gnuplot -p -e "plot '<cat'"

请注意,您无法以任何方式操作图形,例如拖动、调整大小——即使仅仅最大化窗口也会导致gnuplot退出,因为数据不再可用。 - Ruslan
对我来说没有崩溃。gnuplot --version --> gnuplot 5.2 补丁级别 8 - randompast

19

如果您想多次绘制来自管道的数据,则需要以某种方式将其存储在内存中。 我首选的方法是使用/dev/shm中的临时文件,它存在于大多数Linux系统中并映射到RAM。 为了保持干净,我设置了一个陷阱,在退出时删除临时文件。

示例(使用您的 data.txt):

cat data.txt | (cat > /dev/shm/mytempfile && trap 'rm /dev/shm/mytempfile' EXIT && gnuplot -e "set terminal dumb; plot for[col=2:4] '/dev/shm/mytempfile' using 1:col title columnheader(col) with lines")

结果:

12 ++------------+-------------+-------------+-------------+------------**
   +             +             +             +             + Best ****** +
   |                                                        Worst***#### |
10 ++                                              *******Average $$$$$$++
   |                                           ****                      |
   |                                        ***    $$$$               $$$$
 8 ++                                     **     $$    $$        $$$$$  ++
   |                                    **     $$        $$    $$        |
   |                               *****    $$$              $$       ####
 6 ++                          ****       $$ ############# $$    #####  ++
   |                         **         $$ ##             #  ####        |
   |                       **        $$$ ##                ##            |
   |                     **      $$$$  ##                                |
 4 ++         ***********   $$$$$  ####                                 ++
   |     *****  ###################                                      |
   | ****   $$##                                                         |
 2 **    $$$##                                                          ++
   #########                                                             |
   + $$          +             +             +             +             +
 0 $$------------+-------------+-------------+-------------+------------++
   0             2             4             6             8             10

2
更好的方法是将 set terminal dumb 替换为 set terminal dumb size $COLUMNS $LINES,这样可以考虑当前终端的大小并拉伸输出。 - Ruslan

15

使用gnuplot的-e选项有什么问题? 您可以从shell中使用以下命令将变量data.txt作为输入提供:

gnuplot -e "filename='data.txt';ofilename='test.png'" plot.gnu
你应该能够使用for循环从shell中多次调用上述命令,并对“filename”使用不同的值。
然后,你需要将脚本plot.gnu更改为:
set terminal png
set output ofilename
plot for[col=2:4] filename using 1:col title columnheader(col) with lines

3
使用system()命令如何?
set terminal png
set output "test.png"

# read shell input
# the echo prints the variable, which is then piped to gnuplot
fname = system("read filename; echo $filename")

plot for[col=2:4] fname using 1:col title columnheader(col) with lines 

您现在可以使用以下方式调用:
echo "data.txt" | gnuplot script.gp

-2

混合两个答案:

cat data.txt | gnuplot -e "set terminal png; set output "test.png"; plot for[col=2:4] '<cat' using 1:col title columnheader(col) with lines

1
这样做行不通,因为在gnuplot中无法将从stdin读取与for循环结合使用。请参阅https://dev59.com/Em445IYBdhLWcg3wNXk_以获取解决方法。 - ramn

网页内容由stack overflow 提供, 点击上面的
可以查看英文原文,
原文链接