我正在使用plotly express timeline制作甘特图,参考以下示例:https://medium.com/dev-genius/gantt-charts-in-python-with-plotly-e7213f932f1e。它自动将x轴设置为使用日期,但我实际上想使用整数(例如,项目启动+1,项目启动+6等)。是否有方法使时间轴绘图不使用日期?如果我尝试使用整数,它会把它们当作毫秒处理。
Plotly Express时间轴的Gantt图,使用整数x轴?
7
- Rob
3
我的建议对你有用吗? - vestland
不完全是。我还需要深入研究一下,但它已经接近我所需的解决方案了。谢谢! - Rob
您是否考虑将我的建议标记为被接受的答案? - vestland
5个回答
12
答案:
是的,这是可能的!只需给出整数作为起始和结束“日期”,计算它们之间的差异(delta),并将这些更改应用于您的 fig:
fig.layout.xaxis.type = 'linear'
fig.data[0].x = df.delta.tolist()
绘图
详情:
实际上有一种方法可以实现这一点,尽管文档中指出:
px.timeline函数默认将X轴设置为日期类型,因此它可以像任何时间序列图表一样进行配置。
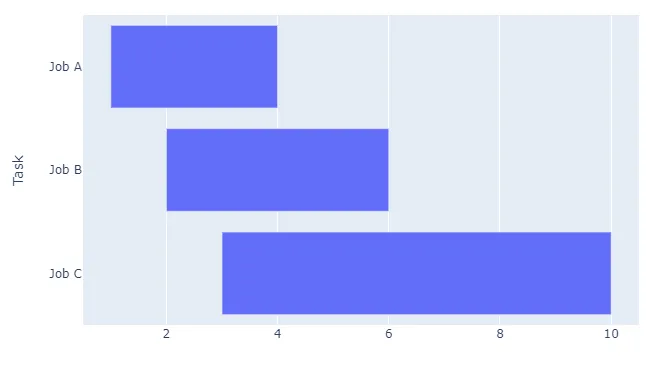
因此,px.timeline()中的所有其他功能似乎都围绕这一事实展开。但是,如果您忽略这一点,将整数用作Start和Finish的值,然后您可以调整几个属性以获得所需的结果。您只需要计算每个Start和Stop之间的差异。例如,如下所示:
df = pd.DataFrame([
    dict(Task="Job A", Start=1, Finish=4),
    dict(Task="Job B", Start=2, Finish=6),
    dict(Task="Job C", Start=3, Finish=10)
])
df['delta'] = df['Finish'] - df['Start']
稍微再调整一下:
fig.layout.xaxis.type = 'linear'
fig.data[0].x = df.delta.tolist()
完整代码:
import plotly.express as px
import pandas as pd

df = pd.DataFrame([
    dict(Task="Job A", Start=1, Finish=4),
    dict(Task="Job B", Start=2, Finish=6),
    dict(Task="Job C", Start=3, Finish=10)
])
df['delta'] = df['Finish'] - df['Start']

fig = px.timeline(df, x_start="Start", x_end="Finish", y="Task")
fig.update_yaxes(autorange="reversed")

fig.layout.xaxis.type = 'linear'
fig.data[0].x = df.delta.tolist()
f = fig.full_figure_for_development(warn=False)
fig.show()
- vestland
7
当我们需要指定颜色时,我认为这比上面的解决方案简单得多。
for d in fig.data:
  filt = df['color'] == d.name
  d.x = df[filt]['Delta'].tolist()
- JounghooLee
3
2抱歉,但您没有回答问题。 - godidier
FYI,这是对vestland答案的补充评论。如果你自己尝试一下,你会发现它比重写process_dataframe_timeline函数(如amos的答案)要简单得多。 - JounghooLee
2这确实是一个非常有用的评论,因为它极大地简化了解决方案!在初始解决方案中的问题在于
fig.data[0].x,所以这个 0 索引只会修复第一组的柱状图,其他的将会被隐藏。这里提到的几行代码为我解决了这个问题,而不需要修改 Plotly 的代码。 - Fedor Chervinskii3
我尝试了这里列出的其他答案,但是如果我指定一个color,它就不起作用。如果我尝试,数据fig.data有多个Bar对象,我不认为它包含分配所有增量所需的数据。然而,我发现我可以在plotly代码中进行猴子补丁(patch),使其不将其转换为时间对象,从而获得正确的结果:
import plotly.express as px
import pandas as pd

def my_process_dataframe_timeline(args):
    """
    Massage input for bar traces for px.timeline()
    """
    print("my method")
    args["is_timeline"] = True
    if args["x_start"] is None or args["x_end"] is None:
        raise ValueError("Both x_start and x_end are required")

    x_start = args["data_frame"][args["x_start"]]
    x_end = args["data_frame"][args["x_end"]]

    # note that we are not adding any columns to the data frame here, so no risk of overwrite
    args["data_frame"][args["x_end"]] = (x_end - x_start)
    args["x"] = args["x_end"]
    del args["x_end"]
    args["base"] = args["x_start"]
    del args["x_start"]
    return args
px._core.process_dataframe_timeline = my_process_dataframe_timeline

df = pd.DataFrame([
    dict(Task="Job A", Start=1, Finish=4, color="1"),
    dict(Task="Job B", Start=2, Finish=6, color="2"),
    dict(Task="Job C", Start=3, Finish=10, color="1")
])
df['delta'] = df['Finish'] - df['Start']

fig = px.timeline(df, x_start="Start", x_end="Finish", y="Task", color="color")
fig.update_yaxes(autorange="reversed")

fig.layout.xaxis.type = 'linear'
fig.show()
显然这样做是不可取的... 得到正式支持会更好。
- amos
0
为了说明JounghooLee的答案如何工作,我想添加这个例子。
在这种情况下。
另请参阅此链接: https://stackoverflow.com/a/71141827/7447940
import plotly.express as px
import pandas as pd

df = pd.DataFrame([
    dict(Task="Job A", Start=1, Finish=10),
    dict(Task="Job B", Start=3, Finish=6),
    dict(Task="Job C", Start=3, Finish=10)
])

df['delta'] = df['Finish'] - df['Start']

fig = px.timeline(df, x_start="Start", x_end="Finish", y="Task", color="Task")


print(fig.data[0].x)
print(fig.data[1].x)
print(fig.data[2].x)

a = [True, False, False]
b = [False, True, False]
c = [False, False, True]

aSeries = pd.Series(a)
bSeries = pd.Series(b)
cSeries = pd.Series(c)

fig.layout.xaxis.type = 'linear'

# the dataFrame df is filtered by the pandas series, to add the specific delta to each of the bars
fig.data[0].x = df[aSeries]['delta'].tolist()
fig.data[1].x = df[bSeries]['delta'].tolist()
fig.data[2].x = df[cSeries]['delta'].tolist()

print(fig.data[0].x)
print(fig.data[1].x)
print(fig.data[2].x)


fig.show()
prints 的输出如下:
[0.]
[0.]
[0.]
(9,)
(3,)
(7,)
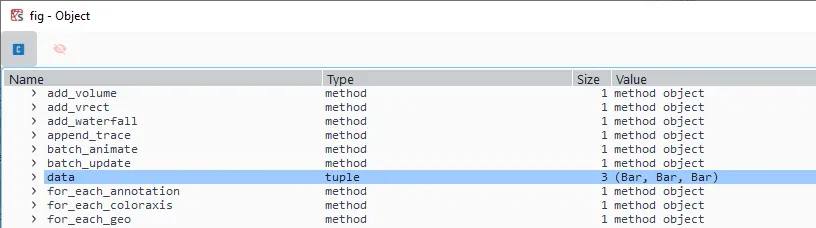
而且 fig.data 包含三个条形图
color,它就无法工作,因为此时fig.data仅包含一个条形图。
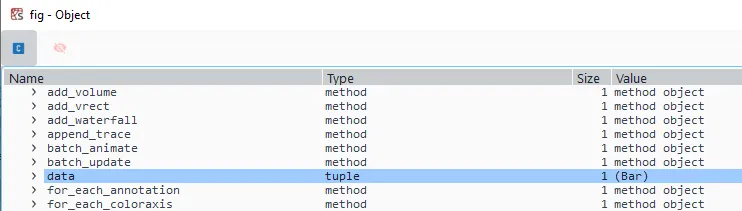
print(fig.data[0].x) 返回
[0. 0. 0.]
在这种情况下。
另请参阅此链接: https://stackoverflow.com/a/71141827/7447940
- Heiko Averbeck
0
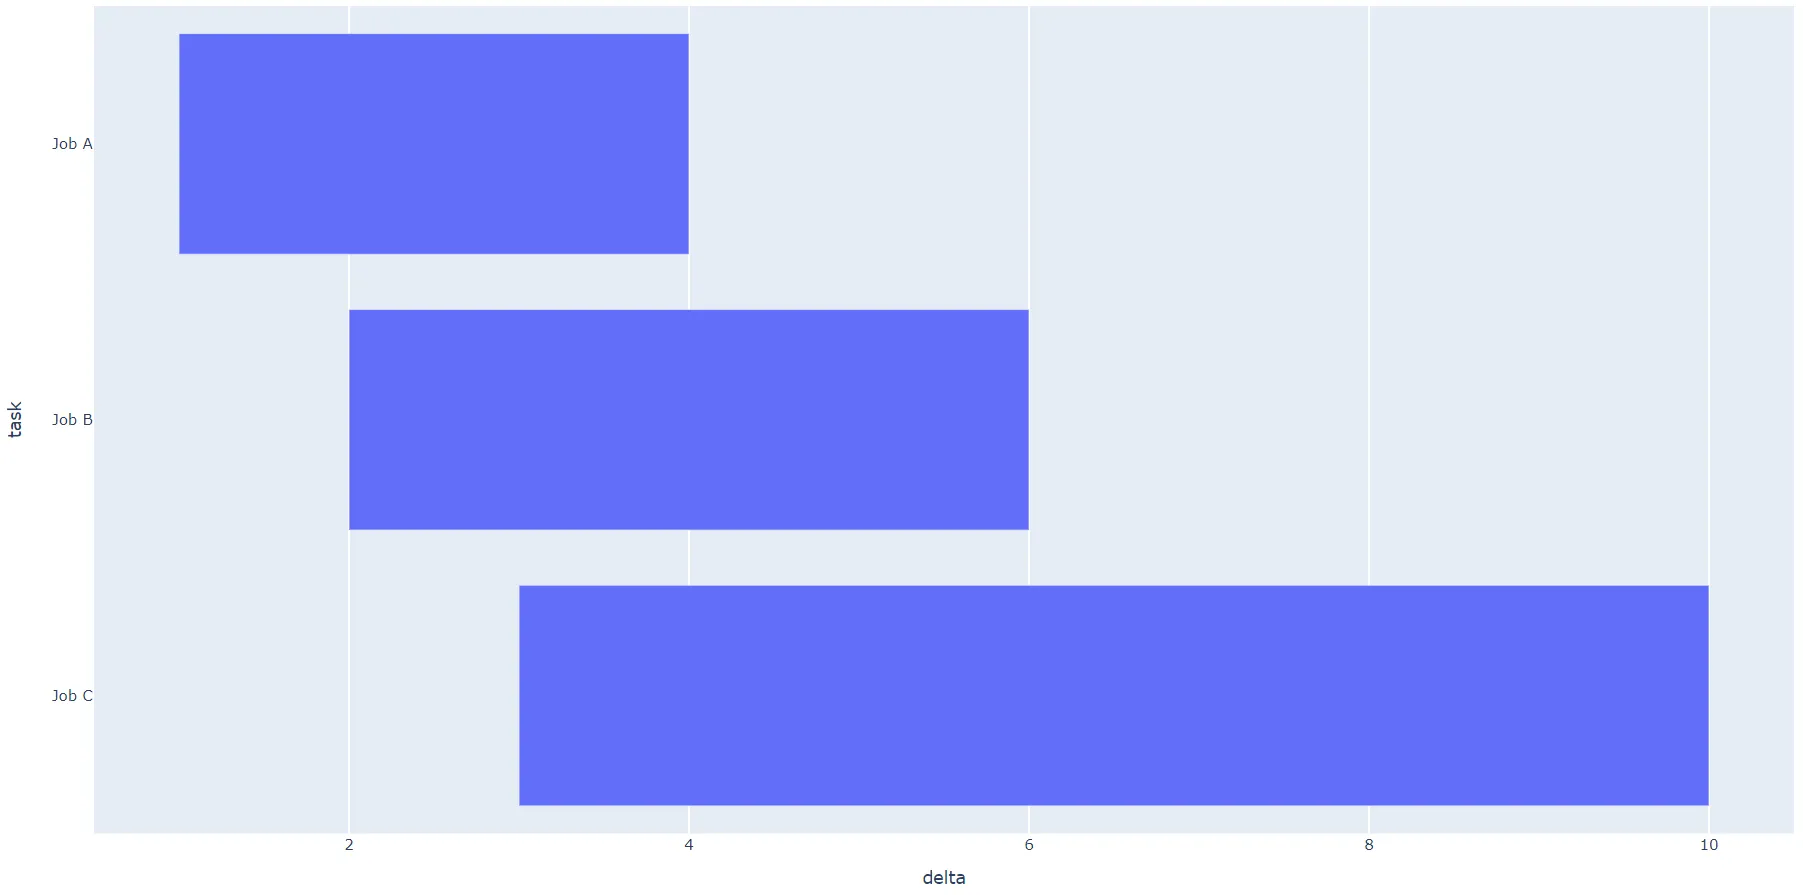
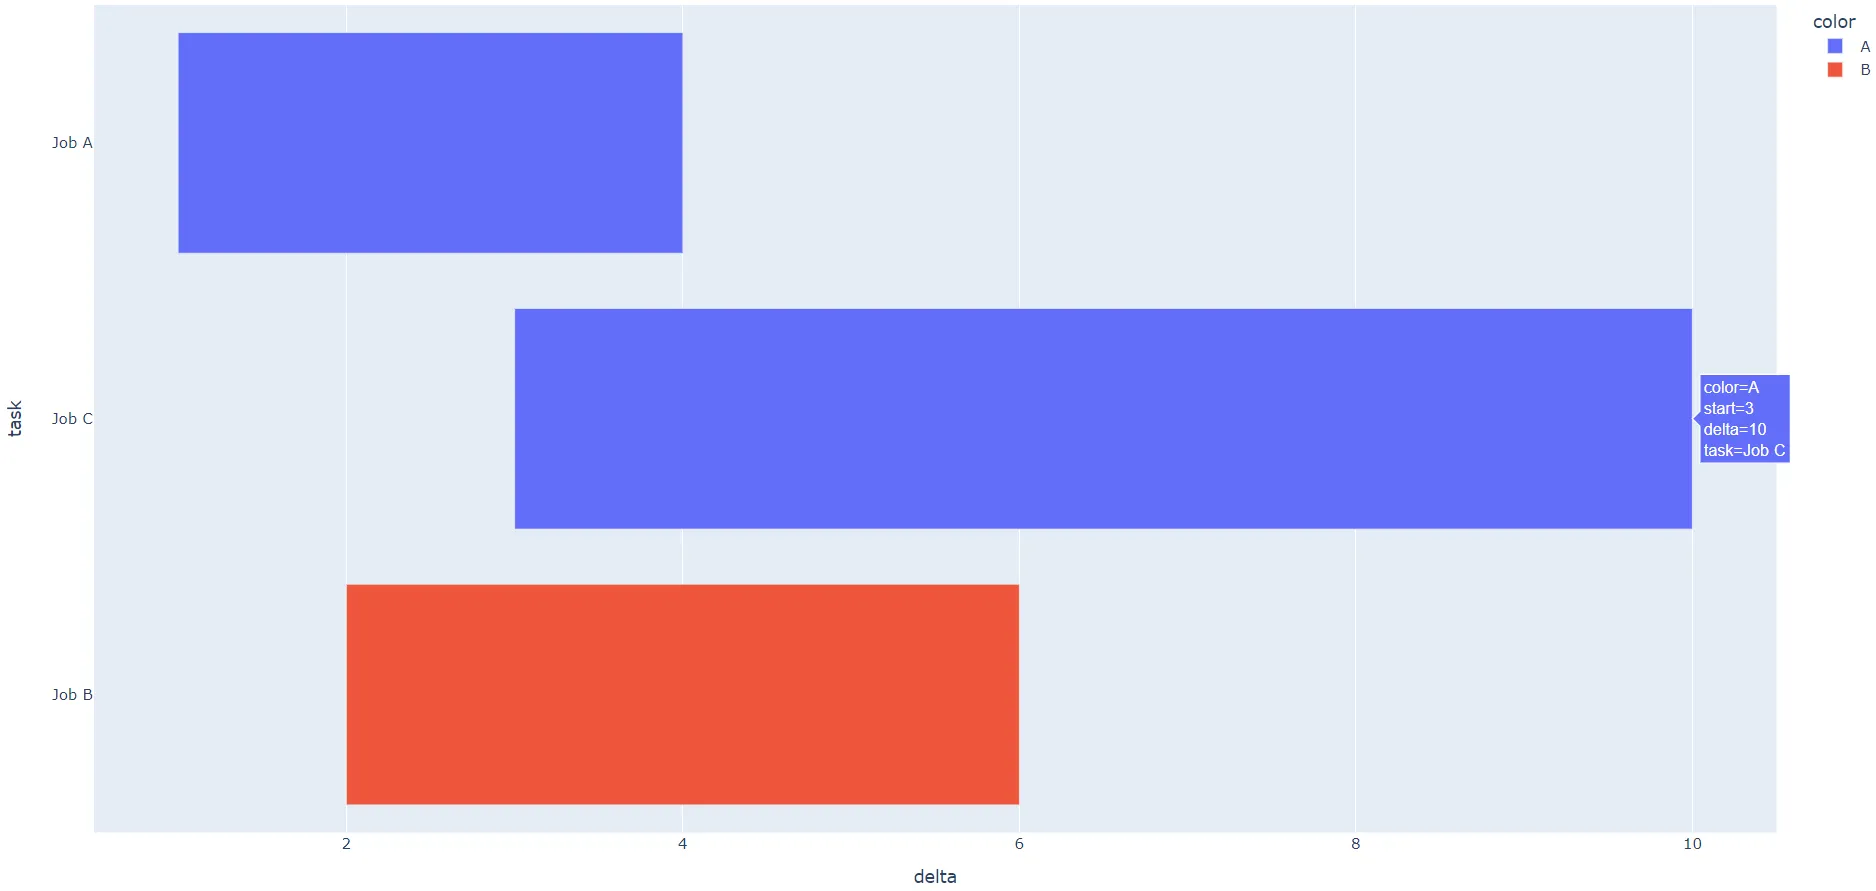
另一个选项是使用plotly条形图,并使用
base参数来指示栏的起点位置,而x值将是任务的持续时间:df = pd.DataFrame([
dict(task="Job A", start=1, end=4),
dict(task="Job B", start=2, end=6),
dict(task="Job C", start=3, end=10)
])
df['delta'] = df['end'] - df['start']
fig = px.bar(df,
base = "start",
x = "delta",
y = "task",
orientation = 'h'
)
fig.update_yaxes(autorange="reversed")
fig.show()
color参数,并根据您指定的列正确分组任务,例如:df = pd.DataFrame([
dict(task="Job A", start=1, end=4, color = "A"),
dict(task="Job B", start=2, end=6, color = "B"),
dict(task="Job C", start=3, end=10, color = "A")
])
df['delta'] = df['end'] - df['start']
fig = px.bar(df,
base = "start",
x = "delta",
y = "task",
color = "color",
orientation = 'h'
)
fig.update_yaxes(autorange="reversed")
fig.show()
- symduk
网页内容由stack overflow 提供, 点击上面的可以查看英文原文,
原文链接
原文链接