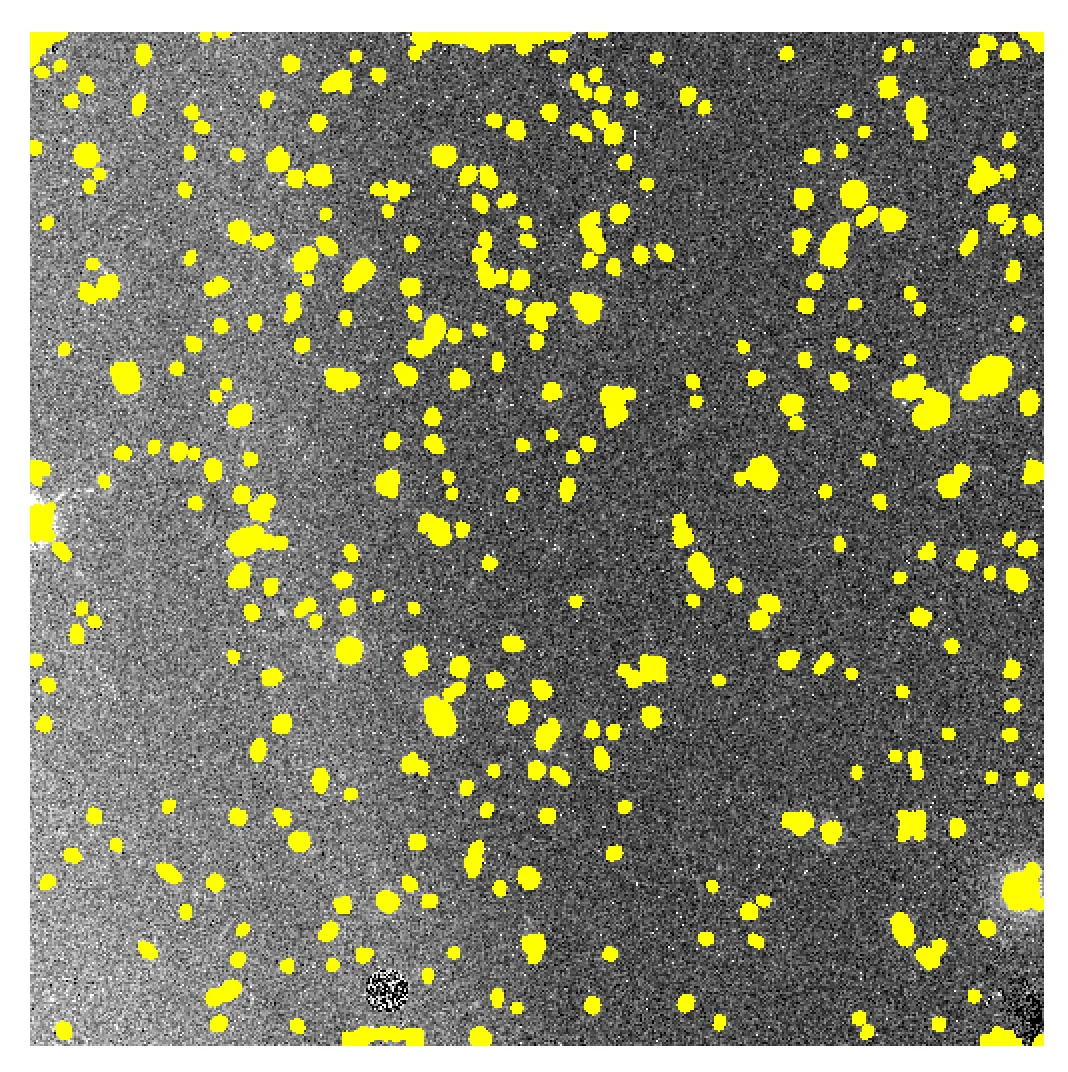
我正在尝试对一些图像数据进行二维曲面拟合。 我附上了这样的数据示例,它基本上是一个1014 x 1014的数组,带有大量噪声。 Example_image。该数组的某些补丁为无效数据,我将其掩蔽并设置为NaN值,如示例图中所示的黄色区域。 如您在图像中所见,从左侧(更亮)到右侧(更暗)存在背景梯度,我正在尝试消除该梯度。 该梯度不能很好地拟合多项式,因此我的目标是进行二维曲面双变量样条拟合,并减去梯度。
我已经尝试了scipy中的许多任务,但大多数都没有返回理想结果。
我已经尝试了scipy中的许多任务,但大多数都没有返回理想结果。
首先,我尝试了 [RectBivariateSpline] 使用NaN值或掩码进行双变量结构化插值),但由于我的图像中有NaN值,运行RectBivariateSpline只会输出NaN。
我还尝试了SmoothBivariateSpline,这是任务的非规则网格版本。我忽略了那些具有NaN值的像素,并将其余部分转换为1D数组作为输入。但由于数组大小太大,它失败了。然后我尝试切割我的数组,尝试在较小的块上运行它,但它给出了以下错误并退出了段错误,我不知道这意味着什么。
fitpack2.py:1044: UserWarning: 进入错误,未返回逼近值。必须满足以下条件: xb<=x[i]<=xe, yb<=y[i]<=ye, w[i]>0, i=0..m-1 如果iopt==-1,则 xb
然后,我尝试首先使用线性插值的griddata在我的图像中填充NaN补丁。由于补丁很大,插值不理想,但至少给了我一个没有NaN的数组。然后我使用这个数组再次运行RectBivariateSpline。但输出数组仍然是NaN。
我怀疑我的图像中的噪声正在破坏两个任务的行为,因此我还尝试首先在我的图像上运行高斯内核来平滑它,然后使用griddata填充NaN补丁,然后运行RectBivariateSpline或SmoothBivariateSpline,但它们仍然给我输出NaN值的数组。
我不确定我是否正确理解了这两个任务的手册,因此我附上以下脚本:
#!/usr/bin/python

import matplotlib
matplotlib.use('qt5agg')
#matplotlib.rc('font',**{'family':'sans-serif','sans-serif':['Helvetica']})
#matplotlib.rc('text.latex', preamble=r'\usepackage{cmbright}')
#matplotlib.rc('text.latex', preamble=r'\usepackage[scaled]{helvet} \renewcommand\familydefault{\sfdefault} \usepackage[T1]{fontenc}')
#matplotlib.rc('text', usetex=True)

import matplotlib.pyplot as plt
import numpy as np
import astropy.io.fits as pyfits
import scipy.interpolate as sp
from astropy.convolution import convolve
from astropy.convolution import Gaussian2DKernel

#------------------------------------------------------------

#Read in the arrays
hdulistorg = pyfits.open('icmj01jrq_flt.fits')
hdulistorg.info()
errarrorg = np.swapaxes(hdulistorg[1].data, 0,1)
hdulist = pyfits.open('jrq_sci_nan_deep.fits')
hdulist.info()
dataarrorg = np.swapaxes(hdulist[0].data, 0,1)    #image array
errarrorg = np.swapaxes(hdulistorg[1].data, 0,1)  #error array

#Flag some of the problematic values, turn NaNs into 0 for easier handling
dataarr = np.copy(dataarrorg)
w=np.isnan(dataarr)
ww=np.where(dataarr == 0)
www=np.where(dataarr > 100)
wwww=np.where(dataarr < 0)

errarr = 1.0 / (np.copy(errarrorg)+1e-5)   # Try to use 1/error as the estimate for weight below
errarr[w] = 0
errarr[ww] = 0
errarr[www] = 0
errarr[wwww]=0
dataarr[w]= 0
dataarr[ww]= 0
dataarr[www]=0
dataarr[wwww]=0


#Make a gaussian kernel smoothed data
maskarr = np.copy(errarr)    #For masking the nan regions so they dun get smoothed
maskarr[:]=0
maskarr[w]=1
maskarr[ww]=1
maskarr[www]=1
maskarr[wwww]=1
gauss = Gaussian2DKernel(stddev=5)
condataarr = convolve(dataarr,gauss,normalize_kernel=True,boundary='extend',mask=maskarr)
condataarr[w]=0
conerrarr = np.copy(errarr)


#Setting x,y arrays for the Spline functions
nx, ny = (1014,1014)
x = np.linspace(0, 1013, nx)
y = np.linspace(0, 1013, ny)
xv, yv = np.meshgrid(x, y)


#Make an 1D version of these 2D arrays
dataarrflat = np.ravel(condataarr[0:200,0:200])   #Try only a small chunk!
xvflat = np.ravel(xv[0:200,0:200])
yvflat = np.ravel(yv[0:200,0:200])
errarrflat = np.ravel(conerrarr[0:200,0:200])
notnanloc = np.where(dataarrflat != 0)            #Not NaNs

#SmoothBivariateSpline!
rect_S_spline = sp.SmoothBivariateSpline(xvflat[notnanloc], yvflat[notnanloc], dataarrflat[notnanloc],w=errarrflat[notnanloc], kx=3, ky=3)


#Also try using grid data to fix the grid?
gddataarr = np.copy(condataarr)
gddataarrflat = np.ravel(gddataarr)
gdloc = np.where(gddataarrflat != 0)              #Not NaNs
gdxvflat = np.ravel(xv)
gdyvflat = np.ravel(yv)
xyarr = np.c_[gdxvflat[gdloc],gdyvflat[gdloc]]
x_grid, y_grid = np.mgrid[0:1013:1014j,0:1013:1014j]

grid_z2 = sp.griddata(xyarr, gddataarrflat[gdloc], (x_grid, y_grid), method='linear')
plt.imshow(grid_z2.T)
#plt.show()

#RectBivariatSpline
rect_B_spline = sp.RectBivariateSpline(x, y, grid_z2.T)


#Result grid (same as input for now)
xnew = np.arange(0, 1013, 1)
ynew = np.arange(0, 1013, 1)
znewS = rect_S_spline(xnew, ynew)
znewB = rect_B_spline(xnew, ynew)
print 'znewS', znewS
print 'znewB', znewB


#Write FITS files
condataarr = np.swapaxes(condataarr, 0, 1)
hdu2 = pyfits.PrimaryHDU(condataarr)
hdulist2 = pyfits.HDUList([hdu2])
hdulist2.writeto('contest.fits',overwrite=True)
hdulist2.close()

hdu3 = pyfits.PrimaryHDU(znewS)
hdulist3 = pyfits.HDUList([hdu3])
hdulist3.writeto('Stest.fits',overwrite=True)
hdulist3.close()
File "tilpass.py", line 5, in
import t660py2 as t660
ImportError: dlopen(/Users/xxxx/inter/t660py2.so, 2): no suitable image found.  Did find:
/Users/xxxx/inter/t660py2.so: unknown file type, first eight bytes: 0x7F 0x45 0x4C 0x46 0x02 0x01 0x01 0x00
- Jeffrey Chan