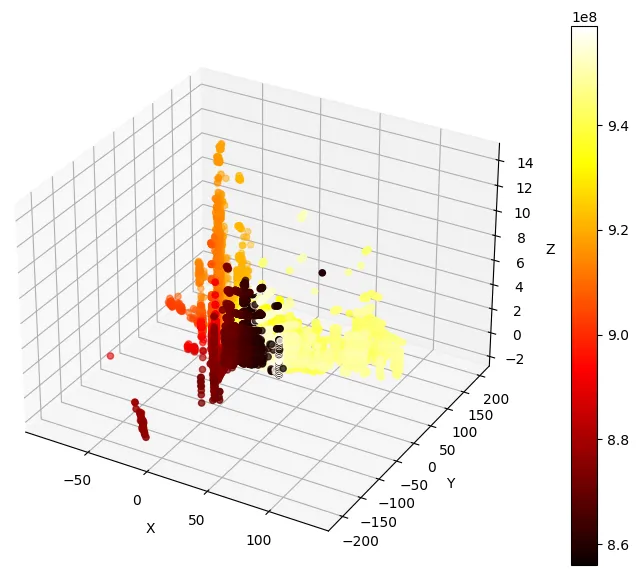
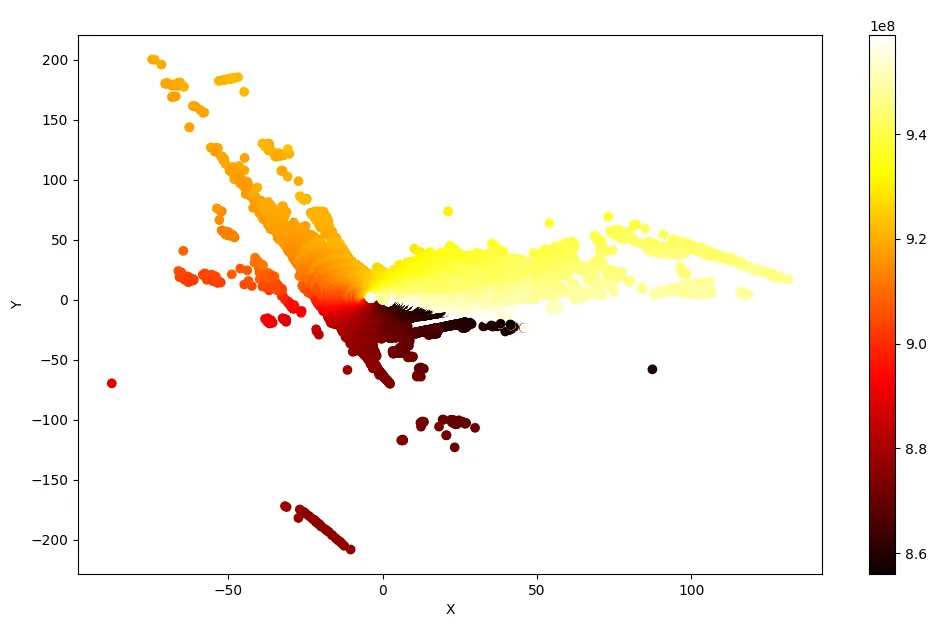
我有几个由LIDAR读数创建的Numpy二进制文件,其中包含3D点云。我希望能够通过从文件中读取它们来为每个点云绘制一个俯视图(正交)。我查阅了各种3D点云库,如Open3d、pyntcloud等,但它们都不支持NPY文件。我该如何绘制它们?
我这里并不是在寻求库的推荐,我只是在寻找可能的方向,因为我还没有找到一种方法可以通过从NPY文件中读取它们来绘制点云。
编辑:当我使用
当我尝试按照 @Dorian 的建议进行绘图时:
我遇到了以下错误:
我这里并不是在寻求库的推荐,我只是在寻找可能的方向,因为我还没有找到一种方法可以通过从NPY文件中读取它们来绘制点云。
编辑:当我使用
np.load()从其中一个文件中读取数据时,它看起来像这样:array([[(-0. , 0. , 0. , 0. , 857827240, 1579782324),
(-0. , 0. , 0. , 0. , 857882120, 1579782324),
(-0. , 0. , 0. , 0. , 857937680, 1579782324),
...,
(-0. , -0. , 0. , 0. , 957653240, 1579782324),
(-0. , -0. , 0. , 0. , 957709120, 1579782324),
(-0. , -0. , 0. , 0. , 957764680, 1579782324)],
[(15.622366 , -8.086195 , 5.7023315 , 0.00392157, 857828544, 1579782324),
(16.292194 , -8.503972 , 5.8512874 , 0.07843138, 857883424, 1579782324),
(15.855744 , -8.374023 , 5.767106 , 0.02352941, 857938984, 1579782324),
...,
(16.500275 , -9.402869 , 6.0786157 , 0.01568628, 957654544, 1579782324),
(16.197226 , -9.334285 , 6.023082 , 0.00392157, 957710424, 1579782324),
(16.260717 , -9.463429 , 6.0455737 , 0.00392157, 957765984, 1579782324)],
[(16.526688 , -8.541684 , 4.6792016 , 0.00392157, 857829848, 1579782324),
(15.844723 , -8.292216 , 4.5818253 , 0. , 857884728, 1579782324),
(15.915991 , -8.414634 , 4.5984206 , 0.00392157, 857940288, 1579782324),
...,
(15.649654 , -8.954793 , 4.6751213 , 0.01176471, 957655848, 1579782324),
(17.318968 , -9.951033 , 4.9357953 , 0.01176471, 957711728, 1579782324),
(16.125185 , -9.398413 , 4.7603803 , 0.00392157, 957767288, 1579782324)],
...,
[( 2.5268526, -1.6420269 , -0.24141277, 0.02745098, 857780808, 1579782324),
( 2.529189 , -1.6714373 , -0.24518971, 0.03137255, 857836368, 1579782324),
( 2.5140662, -1.6922294 , -0.24403782, 0.03137255, 857891248, 1579782324),
...,
( 1.7650445, -1.4837685 , -0.2509078 , 0.02745098, 957606808, 1579782324),
( 1.742465 , -1.5004072 , -0.24779865, 0.02352941, 957662368, 1579782324),
( 1.7232444, -1.5187881 , -0.245681 , 0.02745098, 957718248, 1579782324)],
[(-2.7442074, 0.9481321 , 1.1273874 , 0. , 857786024, 1579782324),
(-2.7466307, 0.94417626, 1.1274364 , 0. , 857841584, 1579782324),
(-2.749064 , 0.94022495, 1.1274853 , 0. , 857896464, 1579782324),
...,
(-3.4345033, 1.3002251 , 1.1344001 , 0. , 957612024, 1579782324),
(-3.4270716, 1.2909878 , 1.1304668 , 0. , 957667584, 1579782324),
(-3.4362614, 1.2907308 , 1.1331499 , 0. , 957723464, 1579782324)],
[(-3.1056237, 1.1257029 , 1.1556424 , 0. , 857782112, 1579782324),
(-3.1041813, 1.1214051 , 1.1539782 , 0. , 857837672, 1579782324),
(-3.102756 , 1.1170869 , 1.1523142 , 0. , 857892552, 1579782324),
...,
(-3.779868 , 1.4852207 , 1.1581781 , 0. , 957608112, 1579782324),
(-3.8071766, 1.4963622 , 1.1718962 , 0. , 957663672, 1579782324),
(-3.7931492, 1.4851598 , 1.163371 , 0. , 957719552, 1579782324)]],
dtype=[('x', '<f4'), ('y', '<f4'), ('z', '<f4'), ('intensity', '<f4'), ('t_low', '<u4'), ('t_high', '<u4')])
当我尝试按照 @Dorian 的建议进行绘图时:
    x = data[:, 0]
    y = data[:, 1]
    z = data[:, 2]
    fig = plt.figure(figsize=(8, 8))
    ax = fig.add_subplot(111, projection='3d')
    ax.scatter(x, y, z)
    plt.show()
我遇到了以下错误:
TypeError                                 Traceback (most recent call last)
<ipython-input-20-d6d9ea7be681> in <module>
      1 fig = plt.figure(figsize=(8, 8))
      2 ax = fig.add_subplot(111, projection='3d')
----> 3 ax.scatter(x, y, z)
      4 plt.show()

~/anaconda3/envs/pointclouds/lib/python3.8/site-packages/mpl_toolkits/mplot3d/axes3d.py in scatter(self, xs, ys, zs, zdir, s, c, depthshade, *args, **kwargs)
   2325         xs, ys, zs, s, c = cbook.delete_masked_points(xs, ys, zs, s, c)
   2326
-> 2327         patches = super().scatter(xs, ys, s=s, c=c, *args, **kwargs)
   2328         art3d.patch_collection_2d_to_3d(patches, zs=zs, zdir=zdir,
   2329                                         depthshade=depthshade)

~/anaconda3/envs/pointclouds/lib/python3.8/site-packages/matplotlib/__init__.py in inner(ax, data, *args, **kwargs)
   1597     def inner(ax, *args, data=None, **kwargs):
   1598         if data is None:
-> 1599             return func(ax, *map(sanitize_sequence, args), **kwargs)
   1600
   1601         bound = new_sig.bind(ax, *args, **kwargs)

~/anaconda3/envs/pointclouds/lib/python3.8/site-packages/matplotlib/axes/_axes.py in scatter(self, x, y, s, c, marker, cmap, norm, vmin, vmax, alpha, linewidths, verts, edgecolors, plotnonfinite, **kwargs)
   4459         else:
   4460             x, y, s, c, colors, edgecolors, linewidths = \
-> 4461                 cbook._combine_masks(
   4462                     x, y, s, c, colors, edgecolors, linewidths)
   4463

~/anaconda3/envs/pointclouds/lib/python3.8/site-packages/matplotlib/cbook/__init__.py in _combine_masks(*args)
   1122                 x = safe_masked_invalid(x)
   1123                 seqlist[i] = True
-> 1124                 if np.ma.is_masked(x):
   1125                     masks.append(np.ma.getmaskarray(x))
   1126             margs.append(x)  # Possibly modified.

~/anaconda3/envs/pointclouds/lib/python3.8/site-packages/numpy/ma/core.py in is_masked(x)
   6520     if m is nomask:
   6521         return False
-> 6522     elif m.any():
   6523         return True
   6524     return False

~/anaconda3/envs/pointclouds/lib/python3.8/site-packages/numpy/core/_methods.py in _any(a, axis, dtype, out, keepdims)
     43
     44 def _any(a, axis=None, dtype=None, out=None, keepdims=False):
---> 45     return umr_any(a, axis, dtype, out, keepdims)
     46
     47 def _all(a, axis=None, dtype=None, out=None, keepdims=False):

TypeError: cannot perform reduce with flexible type
这里有一个小型的数据样本,点击这里查看。
data.shape = (64, 1800)。这不是3D数据,显然无法使用我的方法处理。请问数据中存储了什么内容,并且它是如何序列化的? - Dorian