以下是我插值的输入内容:
x = [-1.01, 5.66, 5.69, 13.77, 20.89]

y = [0.28773, 1.036889, 1.043178, 1.595322, 1.543763]

new_x = [0, 2, 4, 6, 8, 9, 10, 11, 12, 13, 14, 15, 16, 17, 18, 20]
matlab 的 interp1 和 scipy.interpolate 的 interp1d 的结果不同。
结果如下。
new_y_scipy=[0.401171, 0.625806, 0.850442, 1.062384, 1.186291, 1.248244, 1.310198, 1.372152, 1.434105, 1.496059, 1.545429, 1.55267, 1.559911, 1.567153, 1.574394, 1.588877,]

new_y_matlab=[0.401171, 0.625806, 0.850442, 1.064362, 1.201031, 1.269366, 1.3377, 1.406035, 1.47437, 1.542704, 1.593656, 1.586415, 1.579174, 1.571932, 1.564691, 1.550208]
显然,matlab似乎比scipy获得更好的结果。这其中的根本区别是什么?
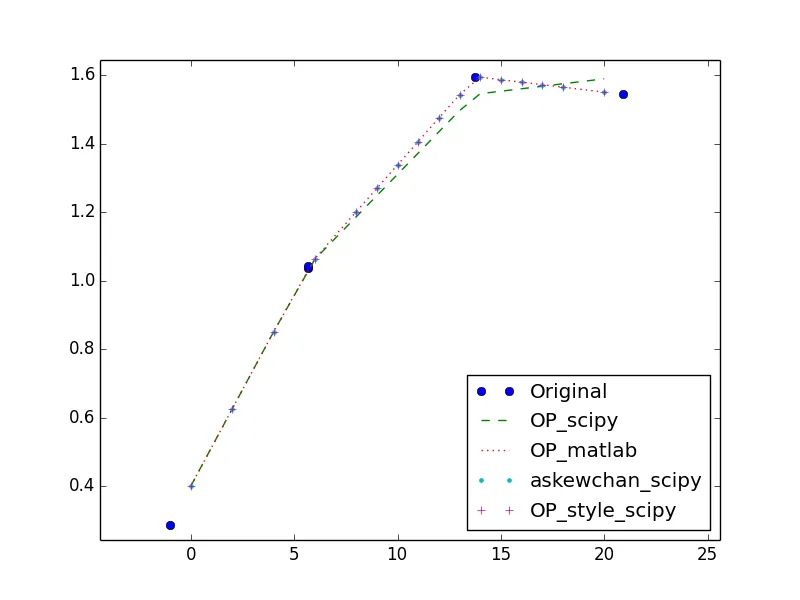
np.allclose(new_y_matlab, interp1d(x,y)(new_x))True- askewchannp.allclose只是检查两个数组是否相同,这里返回True。我的观点是,我认为您在使用scipy时犯了一个错误,因为当我使用scipy时,我得到的结果与您在matlab中得到的结果相同,请参阅我的答案以获取更多信息。 - askewchanx和y数组匹配吗?从我做的图中,看起来你的y数组中的最后两个值几乎被交换了:P - askewchan