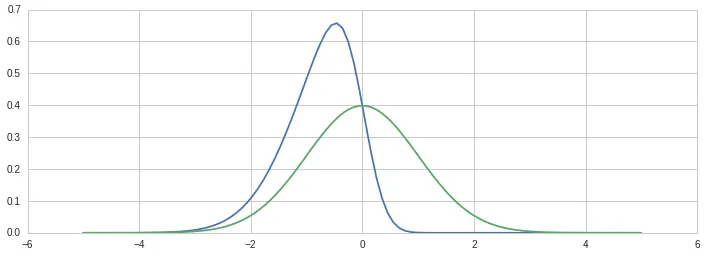
我首先生成PDF曲线作为参考:
NUM_SAMPLES = 100000
SKEW_PARAMS = [-3, 0]
def skew_norm_pdf(x,e=0,w=1,a=0):
t = (x-e) / w
return 2.0 * w * stats.norm.pdf(t) * stats.norm.cdf(a*t)
location = 0.0
scale = 1.0
x = np.linspace(-5,5,100)
plt.subplots(figsize=(12,4))
for alpha_skew in SKEW_PARAMS:
p = skew_norm_pdf(x,location,scale,alpha_skew)
plt.plot(x,p)
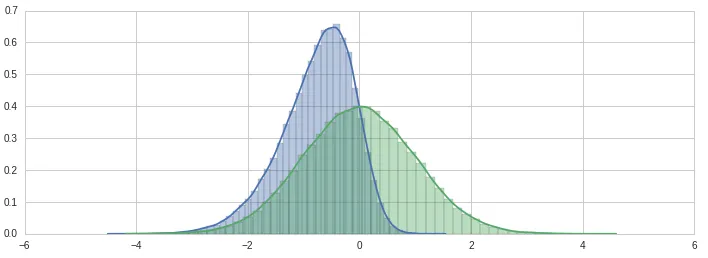
接下来,我找到了一个VB实现的偏态正态分布随机抽样方法,并将其转换为Python:
def rand_skew_norm(fAlpha, fLocation, fScale):
sigma = fAlpha / np.sqrt(1.0 + fAlpha**2)
afRN = np.random.randn(2)
u0 = afRN[0]
v = afRN[1]
u1 = sigma*u0 + np.sqrt(1.0 -sigma**2) * v
if u0 >= 0:
return u1*fScale + fLocation
return (-u1)*fScale + fLocation
def randn_skew(N, skew=0.0):
return [rand_skew_norm(skew, 0, 1) for x in range(N)]
plt.subplots(figsize=(12,4))
for alpha_skew in SKEW_PARAMS:
p = randn_skew(NUM_SAMPLES, alpha_skew)
sns.distplot(p)
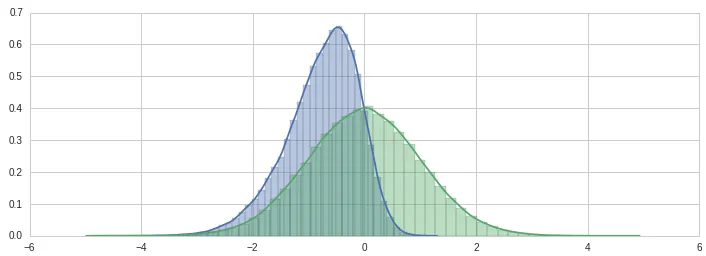
然后写了一个快速版本(未经广泛测试)看起来是正确的:
def randn_skew_fast(N, alpha=0.0, loc=0.0, scale=1.0):
sigma = alpha / np.sqrt(1.0 + alpha**2)
u0 = np.random.randn(N)
v = np.random.randn(N)
u1 = (sigma*u0 + np.sqrt(1.0 - sigma**2)*v) * scale
u1[u0 < 0] *= -1
u1 = u1 + loc
return u1
plt.subplots(figsize=(12,4))
for alpha_skew in SKEW_PARAMS:
p = randn_skew_fast(NUM_SAMPLES, alpha_skew)
sns.distplot(p)