使用 Pandas 数据框绘制带有数据点的条形图

4

我希望能够从Pandas数据框中绘制一个水平条形图,但不知道如何开始。

我的数据长这样

          max  min  point1  point2
Series 1   50   10      40      30
Series 2   60   20      50      40

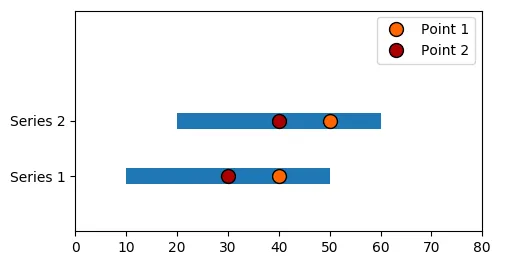
我忍不住用画图软件画了一张图。我希望最终效果是这样的:
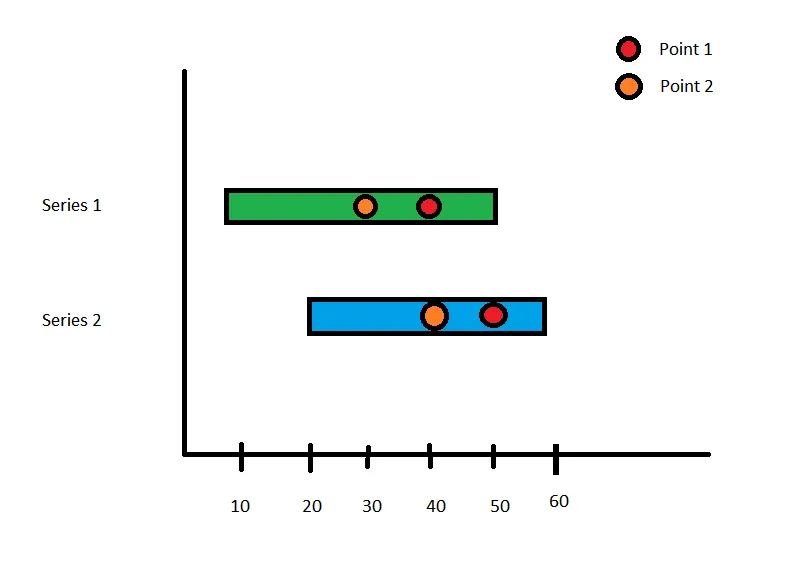
enter image description here

颜色不重要,这里是数据框:

import pandas as pd

data = pd.DataFrame(dict(min=[10, 20],
                          max=[50, 60],
                          point1=[40, 50],
                          point2=[30, 40]),
                          index=["Series 1", "Series 2"])

1
你想要箱线图还是条形图?箱线图是一种特定类型的图表,它绘制了一个图表的中位数、四分位距和异常值,而条形图则更为通用。我认为你想要制作一个条形图 - 是这样吗? - mprat
是的,没错。但我不知道如何为条形图设置最小值和最大值。 - Pat
4个回答

3
这里有一个与问题中图片非常相似的图形。它是由matplotlib.pyplot生成的。

enter image description here

import pandas as pd
import matplotlib.pyplot as plt


data = pd.DataFrame(dict(min=[10, 20],
                          max=[50, 60],
                          point1=[40, 50],
                          point2=[30, 40]),
                          index=["Series 1", "Series 2"])

plt.barh(range(len(data)), data["max"]-data["min"], height=0.3, left=data["min"])

plt.plot(data["point1"], range(len(data)), linestyle="", markersize=10, 
         marker="o", color="#ff6600", label="Point 1", markeredgecolor="k")
plt.plot(data["point2"], range(len(data)), linestyle="", markersize=10, 
         marker="o", color="#aa0000", label="Point 2", markeredgecolor="k")
plt.yticks(range(len(data)),data.index)

plt.ylim(-1,3)
plt.xlim(0,80)
plt.legend()
plt.show()

你最近真的帮了我很多,朋友! - Pat
只有一件小事:要居中显示条形图,请使用align='center'。 - Pat
对于matplotlib 2.0之前的版本,您需要使用 align = "center" 手动将条形图居中。 - ImportanceOfBeingErnest

1
你可以使用matplotlib进行任何绘图。
你可以像这样指定水平条形图的底部/顶部(使用你的数据框作为参考):
import numpy as np
import matplotlib.pyplot as plt

# make a bar floating in space
index_labels = data.index
index = np.arange(index_labels)
right_edge = data['max']
left_edge = data['min']
plt.barh(index, right_edge, left=left_edge)
plt.yticks(index, index_labels)

这应该生成一个水平条形图,您需要指定条的起点和终点。您可以在此处参考文档:http://matplotlib.org/api/pyplot_api.html#matplotlib.pyplot.barh并查看示例:http://matplotlib.org/1.2.1/examples/pylab_examples/barh_demo.html


0

我不知道你的数据是什么,但是pandas可以通过自动聚合最小值、最大值和百分位数来绘制平面数据的箱线图。一个接近你的例子可能是这样的:

import pandas as pd

pd.DataFrame({
    "Series 2":[20,25,20,30,45,60], 
    "Series 1":[10,12,20,40,45,50]
}).plot.box(vert=False)

enter image description here


0
如果你真的需要手工制作带有点和矩形的图表,你可以像这样做:
from matplotlib import pyplot as plt
from matplotlib.patches import Rectangle, Circle

fig = plt.figure()
ax = fig.add_subplot(111, xlim=(0, 70), ylim=(0, 70))
ax.add_artist(Rectangle(xy=(10, 49), color="g", width=40, height=2))
ax.add_artist(Circle(xy=(30, 50), color="orange", radius=1))
ax.add_artist(Circle(xy=(40, 50), color="red", radius=1))
ax.add_artist(Rectangle(xy=(20, 19), color="b", width=40, height=2))
ax.add_artist(Circle(xy=(40, 20), color="orange", radius=1))
ax.add_artist(Circle(xy=(50, 20), color="red", radius=1))
plt.show()

enter image description here


好的,@importanceofbeingernest用手工制作更快。 - Pokulo

网页内容由stack overflow 提供, 点击上面的
可以查看英文原文,
原文链接