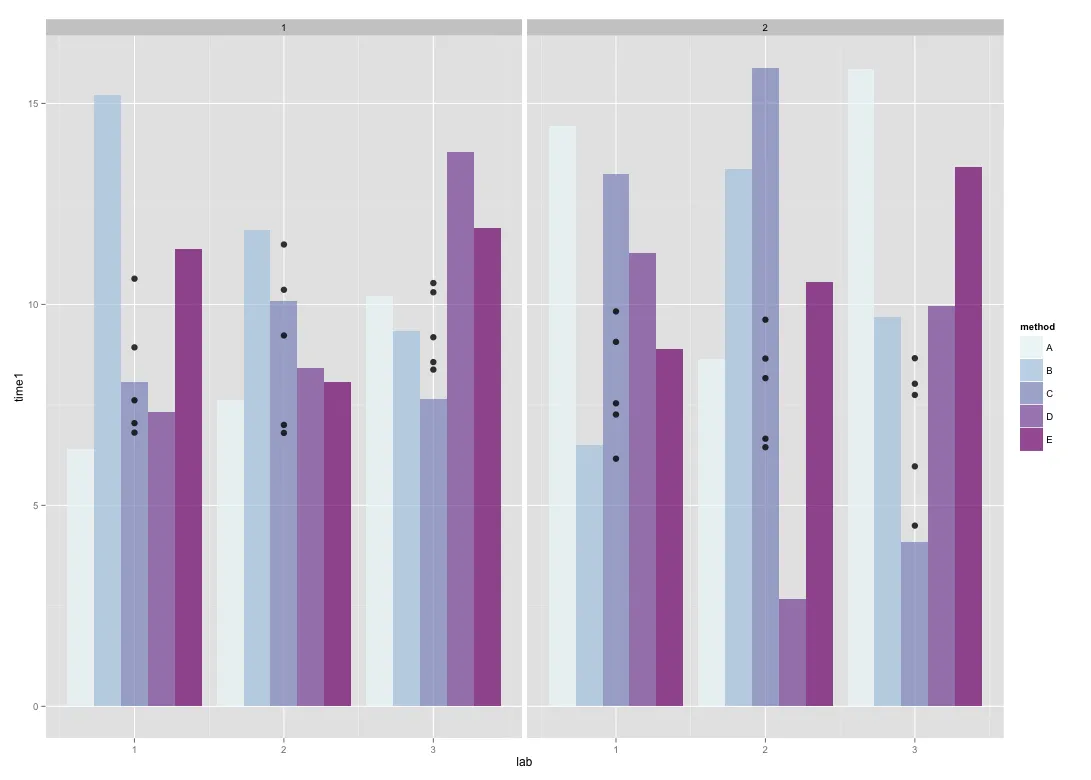
我有一个包含两个时间点测量数据的数据集。我已经制作了第一个时间点数据的条形图,并希望添加第二个时间点的数据点(这只是作为参考)。如下所示,数据点已存在,但它们没有正确的x轴位置(即,它们都在同一个x值上,而不像条形图那样分布)。
如何解决这个问题?
library(ggplot2)

MyData = data.frame(
  method=rep(c("A","B","C","D","E"),times=3),
  time1=rnorm(30,10,3),
  time2=rnorm(30,8,2),
  lab=rep(rep(c(1,2,3),each=5),times=2),
  cat=rep(c(1,2),each=15)
)

p <- ggplot(data = MyData,
            aes(x=lab)) +
  geom_bar(aes(y=time1,fill=method),
           stat="identity",
           position="dodge",
           alpha=.7
  ) +
  geom_point(aes(y=time2,group=method),
           stat="identity",
           position="dodge",
           alpha=.8,
           size=3) +
  scale_fill_brewer(palette=3) +
  facet_grid(. ~ cat)
p