ggplot2没有绘制所有的数据点

4

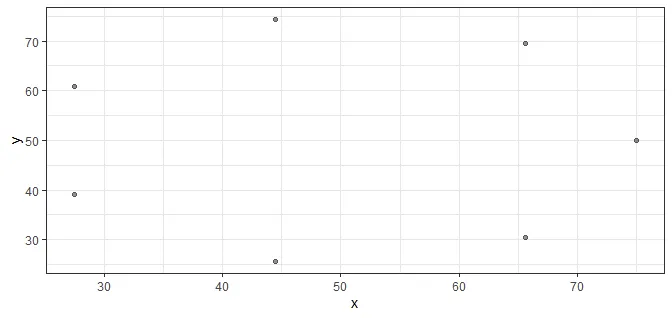
我试图通过ggplot2绘制7个圆形数据点的图表,但是尝试绘制时只显示了6个,我不知道为什么会出现这种情况。

以下是代码:

# Function for the points
circleFun <- function(center = c(-1, 1), diameter = 1, npoints = 7) {
  r <- diameter / 2
  tt <- seq(0, 2 * pi, length.out = npoints)
  xx <- center[1] + r * cos(tt)
  yy <- center[2] + r * sin(tt)
  return(data.frame(x = xx, y = yy))
}

# example with 7 points
ej <- 
  circleFun(diameter = 50, center = c(50,50), npoints = 7)


# plot

ej |> 
  ggplot(aes(x = x, y = y)) +
  geom_point(alpha = 0.4) +
  theme_bw()

有人知道为什么会发生这种情况吗?


3
第1行和第7行是相同的,所以它们的点会重叠。由于alpha值为0.4,这些点看起来略微更暗。你可以通过添加“x = jitter(x)”来使这更加明显(仅用于演示,实际生产中不需要这样做)。鉴于数据是相同的,我不确定你希望看到什么结果。 - r2evans
1个回答

4

第1行和第7行是相同的,因此它们的点重叠在一起。根据您的 alpha = 0.4,点位稍微更暗。您可以通过添加x = jitter(x)来使其明显(用于演示,不建议在实际生产中这样做)。鉴于数据相同,我不确定您希望看到什么。

如果您想要7个不同的点,则建议您创建n+1并删除最后一个(或第一个)点。


circleFun <- function(center = c(-1, 1), diameter = 1, npoints = 7) {
  r <- diameter / 2
  tt <- seq(0, 2 * pi, length.out = npoints + 1)  # changed
  xx <- center[1] + r * cos(tt)
  yy <- center[2] + r * sin(tt)
  data.frame(x = xx, y = yy)[-1,,drop = FALSE]    # changed
}

## unchanged from here on
ej <- 
  circleFun(diameter = 50, center = c(50,50), npoints = 7)
ej |> 
  ggplot(aes(x = x, y = y)) +
  geom_point(alpha = 0.4) +
  theme_bw()

enter image description here

(顺便说一下,特别是当函数的唯一结束点是显而易见的时候,不需要显式调用return(.)。这确实没有问题,但它会在调用堆栈上添加一个步骤,没有添加任何价值。它可能是声明性/自我记录的,因此这是一个风格/主观的观点。)


网页内容由stack overflow 提供, 点击上面的
可以查看英文原文,
原文链接