在R中使用ggplot2制作多个变量的堆叠条形图

14

我在使用ggplot2制作堆叠式条形图时遇到了一些问题。我知道如何使用barplot()制作一个,但是我想使用ggplot2,因为它可以通过 'position = 'fill'' 使条形图的高度相同(如果我没有弄错的话)。

我的问题是我有多个变量要叠加在一起绘制;我的数据看起来像这样:

dfr <- data.frame(
  V1 = c(0.1, 0.2, 0.3),
  V2 = c(0.2, 0.3, 0.2),
  V3 = c(0.3, 0.6, 0.5),
  V4 = c(0.5, 0.1, 0.7),
  row.names = LETTERS[1:3]
)

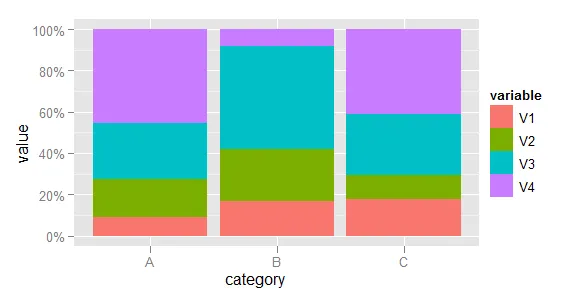
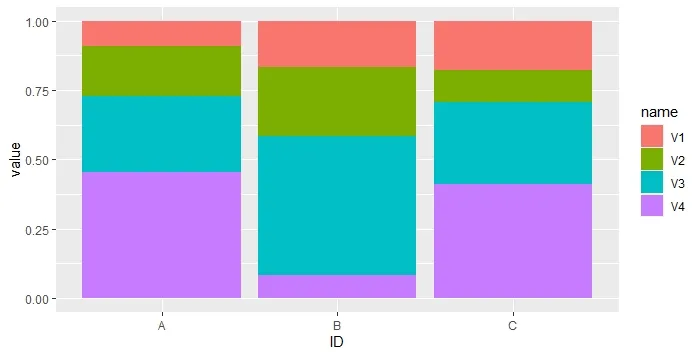
我想要一个图表,其中 X 轴上有 A、B 和 C 类别,并且对于每个类别,在 Y 轴上堆叠 V1、V2、V3 和 V4 的值。大多数图表只在 Y 轴上绘制一个变量,但我相信可以通过某种方式实现这一点。

请问如何使用 ggplot2 实现此功能?谢谢!


欢迎来到 SO。+1添加示例数据。 - Andrie
如果您发现任何答案有帮助,请选择其中一个作为您接受的答案。 - Paul Hiemstra
3个回答

24

首先进行一些数据操作。将类别添加为变量,然后将数据融合到长格式。

dfr$category <- row.names(dfr)
mdfr <- melt(dfr, id.vars = "category")

现在使用名为variable的变量来确定每个条形图的填充颜色。

library(scales)
(p <- ggplot(mdfr, aes(category, value, fill = variable)) +
    geom_bar(position = "fill", stat = "identity") +
    scale_y_continuous(labels = percent)
)

(编辑:代码已更新以使用scales包,因为自ggplot2 v0.9起需要使用。)

在这里输入图像描述


@lselzer,英雄所见略同!在我看来,下一次,即使非常相似,您也不应该犹豫地发布您的答案。 - Roman Luštrik
非常感谢你,Richie!这对我很有用。不过我有一个问题——如果我使用'p <- ggplot(mdfr, aes(category, value, fill = variable, position = 'fill')) +
  • geom_bar()'来绘制它,那么柱状图并没有向上延伸到相同的高度。我需要做些什么才能让图表实现这一点呢?谢谢!
- Annemarie
1
对我来说不起作用...我得到了continuous_scale(c("y", "ymin", "ymax", "yend", "yintercept", : unused argument(s) (formatter = "percent")的错误。 - Rachit Agrawal
@RachitAgrawal,我认为你必须更新代码。使用library(scales),然后更改上面的代码:scale_y_continuous(labels=percent)。 - Manoel Galdino
1
新的“ggplot”语法显然需要“geom_bar(position = "fill", stat = "identity")”。 - PatrickT

4

对不起,我发起了一个新的回答,但我实际上只是想在@Richie提供的优美解决方案中添加一条评论。 我没有足够的积分发布评论,所以这就是我的情况:

... + geom_bar(position="fill") 在我的绘图中引发了错误,我正在使用ggplot2版本0.9.3.1和reshape2而不是reshepe进行melting。

error_message:
*Mapping a variable to y and also using stat="bin".
  With stat="bin", it will attempt to set the y value to the count of cases in each group.
  This can result in unexpected behavior and will not be allowed in a future version of ggplot2.
  If you want y to represent counts of cases, use stat="bin" and don't map a variable to y.
  If you want y to represent values in the data, use stat="identity".
  See ?geom_bar for examples. (Deprecated; last used in version 0.9.2)
stat_bin: binwidth defaulted to range/30. Use 'binwidth = x' to adjust this.
Error in pmin(y, 0) : object 'y' not found*

所以我把它改成了 geom_bar(stat='identity'),然后就成功了。

谢谢您的发布,我无法解决这个错误! - I Like to Code

4

你也可以像这样做

library(tidyverse)
dfr %>% rownames_to_column("ID") %>% pivot_longer(!ID) %>%
  ggplot() +
  geom_col(aes(x = ID, y = value, fill = name), position = 'fill')

enter image description here


网页内容由stack overflow 提供, 点击上面的
可以查看英文原文,
原文链接