使用ggplot2绘制不同的堆叠条形图

8

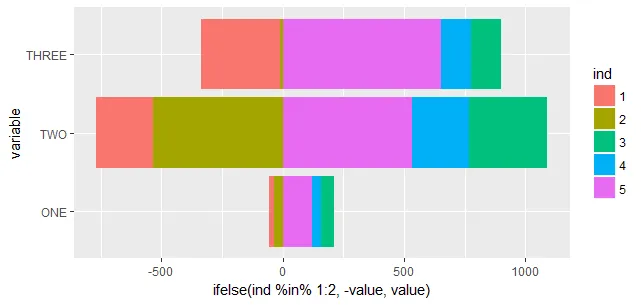
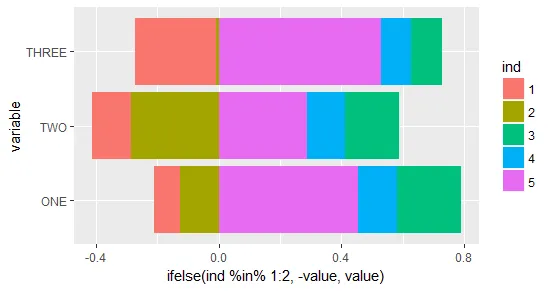
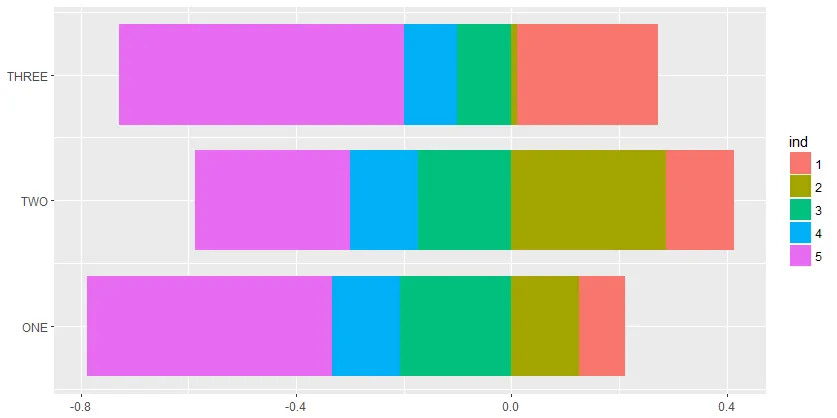
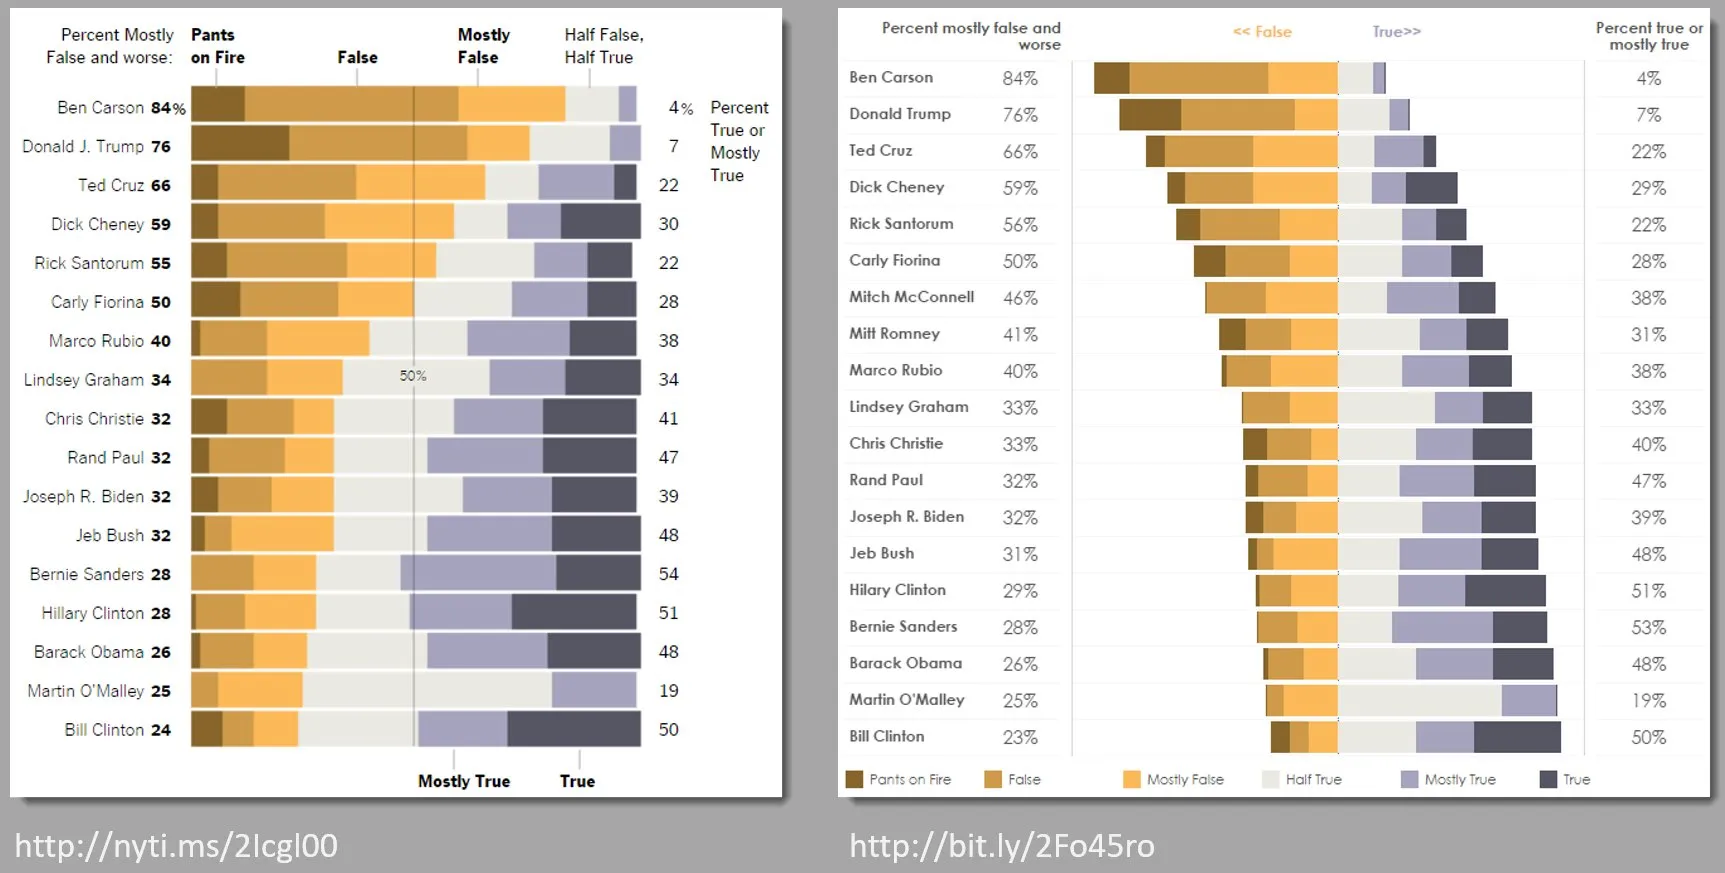
有没有一种方法可以使用ggplot2创建类似下图右侧的分散堆积条形图?

enter image description here

可复制示例的数据

library(ggplot2)
library(scales)
library(reshape)

dat <- read.table(text = "    ONE TWO THREE
                  1   23  234 324
                  2   34  534 12
                  3   56  324 124
                  4   34  234 124
                  5   123 534 654",sep = "",header = TRUE)

# reshape data
datm <- melt(cbind(dat, ind = rownames(dat)), id.vars = c('ind'))

# plot
ggplot(datm,aes(x = variable, y = value,fill = ind)) + 
  geom_bar(position = "fill",stat = "identity") +
  coord_flip()

可能是Simpler population pyramid in ggplot2的重复问题。 - Mako212
2个回答

8
当然,正值会正向叠加,负值会负向叠加。不要使用位置fill。只需将您想要的定义为负值,并确保它们实际上是负数。您的示例仅具有正分数。例如:
ggplot(datm, aes(x = variable, y = ifelse(ind %in% 1:2, -value, value), fill = ind)) + 
    geom_col() +
    coord_flip()

enter image description here

如果你想将比例扩展到1,你需要进行一些预处理:


library(dplyr)
datm %>% 
  group_by(variable) %>% 
  mutate(value = value / sum(value)) %>% 
  ggplot(aes(x = variable, y = ifelse(ind %in% 1:2, -value, value), fill = ind)) + 
  geom_col() +
  coord_flip()

enter image description here


我是唯一注意到条形图顺序错误的人吗?3、4、5的顺序颠倒了... - Tomasz Wojtas
@TomaszWojtas,我通常会忽略那些不属于问题本身的事情。 - Axeman

3
一个极端的方法是自己计算这些盒子。以下是一种方法。
dd <- datm %>% group_by(variable) %>% 
  arrange(desc(ind)) %>% 
  mutate(pct = value/sum(value), right = cumsum(pct), left=lag(right, default=0))

那么您可以使用以下方式绘图:
ggplot(dd) + 
  geom_rect(aes(xmin=right, xmax=left, ymin=as.numeric(variable)-.4, ymax=as.numeric(variable)+.4, fill=ind)) + 
  scale_y_continuous(labels=levels(dd$variable), breaks=1:nlevels(dd$variable))

要得到左侧的图形,只需按原样排列盒子。为了得到右侧的图形,您只需稍微移动盒子。这将使所有第3个盒子的右边缘对齐。

ggplot(dd %>% group_by(variable) %>% mutate(left=left-right[ind==3], right=right-right[ind==3])) + 
  geom_rect(aes(xmin=right, xmax=left, ymin=as.numeric(variable)-.4, ymax=as.numeric(variable)+.4, fill=ind)) + 
  scale_y_continuous(labels=levels(dd$variable), breaks=1:nlevels(dd$variable))

在这里输入图片描述

也许有点过头了,但这样可以更好地控制。


是的,如果目标是同时填充到1和堆叠pos和neg,我相信无论如何都需要预先计算。但是你仍然应该能够只缩放所有级别到1次,然后更改为负数并使用位置堆栈进行绘图,我想。不需要geom_rect吗? - Axeman
@Axeman 看起来没错。老实说,我不知道 ggplot 如何处理叠加负值条形图。我只是想展示你基本上可以画出任何你想要的东西,以及它可能会看起来像什么。 - MrFlick
公平地说,如果我没记错的话,负叠加在某个时候可能已经改变了,大约一年前左右?同意,每当事情不如你所愿时,你可以画出像“rect”这样的基本图形! - Axeman

网页内容由stack overflow 提供, 点击上面的
可以查看英文原文,
原文链接