这是我的代码:
import numpy as np
from scipy.stats.kde import gaussian_kde
from scipy.stats import norm
from numpy import linspace,hstack
from pylab import plot,show,hist
import re
import json
attribute_file="path"
attribute_values = [line.rstrip('\n') for line in open(attribute_file)]
obs=[]
#Assume the list obs as loaded
obs=np.asarray(osservazioni)
obs=np.sort(obs,kind='mergesort')
x_min=osservazioni[0]
x_max=osservazioni[len(obs)-1]
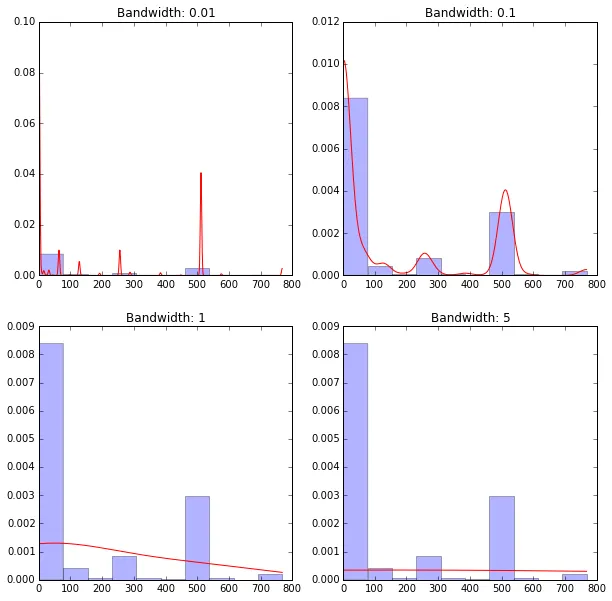
# obtaining the pdf (my_pdf is a function!)
my_pdf = gaussian_kde(obs)
# plotting the result
x = linspace(0,x_max,1000)
plot(x,my_pdf(x),'r') # distribution function
hist(obs,normed=1,alpha=.3) # histogram
show()
new_values = np.asarray([-1, 0, 2, 3, 4, 5, 768])[:, np.newaxis]
for e in new_values:
print (str(e)+" - "+str(my_pdf(e)*100*2))
问题: obs数组包含所有观察值的列表。 我需要计算新值的分数(介于0和1之间)
[-1, 0, 2, 3, 4, 500, 768]
因此,-1的值必须具有离散的分数,因为它在分布中没有出现,但紧邻着非常常见的1值。