我使用
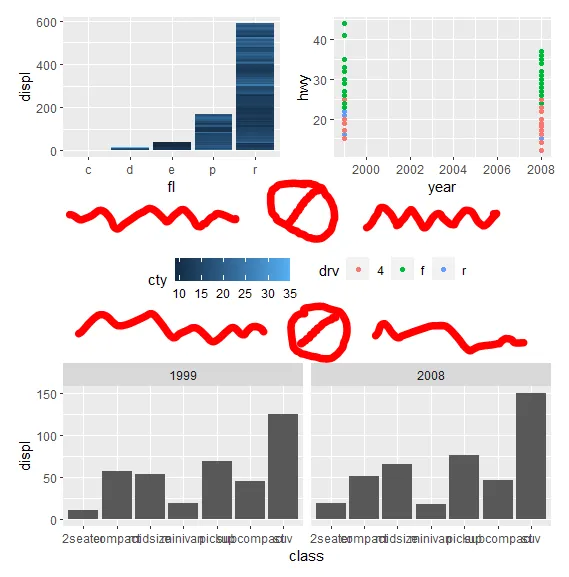
ggplot2 包制作了3个图表。为了将这些图表排列在一个单独的图像中,我使用了 patchwork 包。 我将其中2个图表放置在顶部,公共图例放置在这些图表下方,并在公共图例下方放置第三个图表。 我使用 guide_area() 函数创建公共图例空间,但是随之创建了大量未使用的空白区域。
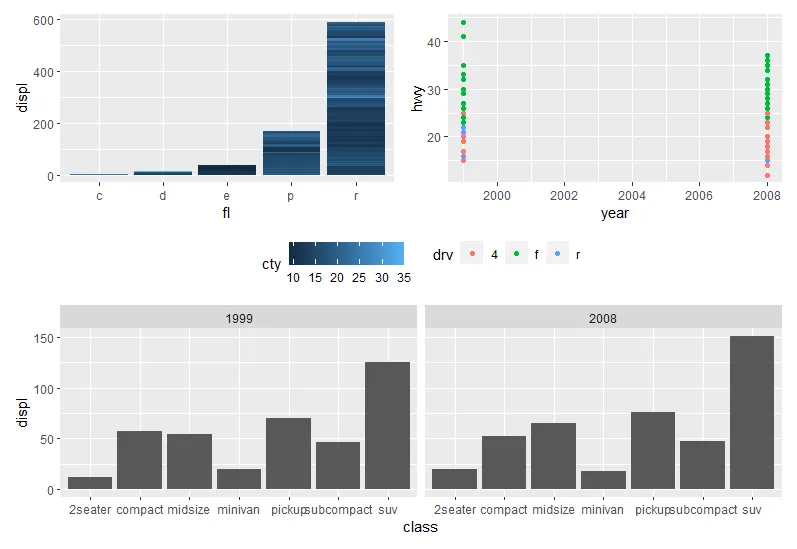
如何将此未使用的空白区域最小化?
library(ggplot2)
library(patchwork)

p1 <- ggplot(data = mpg,
             aes(x = fl,
                 y = displ)) +
  geom_col(aes(fill = cty))

p2 <- ggplot(data = mpg,
             aes(x = year,
                 y = hwy)) +
  geom_point(aes(color = drv))

p3 <- ggplot(data = mpg,
             aes(x = class,
                 y = displ)) +
  geom_col() +
  facet_grid(~year)

((p1+p2)/guide_area()/p3) +
  plot_layout(guides = "collect") &
  theme(legend.position = "bottom")
图中留白以不同的大小和比例存在于图形中(留白用红色标记)。