大家好,我正在使用一个小数据框来构建一些 ggplot2 图。我的数据框是 df,并在末尾包含了 dput()。我已经绘制了图形,问题出现在我使用 patchwork 时。我希望最终的图形没有空格,这样中间的线(即轴)可以将图形连接在一起。以下是代码:
library(ggplot2)
library(patchwork)
library(cowplot)
library(ggtext)
#Plot 1
G1 <- ggplot(df,aes(x=Var1,y=Var2))+
  geom_line(aes(color=Group,group=Group),size=1)+
  geom_point(aes(color=Group,group=Group,shape=Group),size=2)+
  scale_y_continuous(limits = c(0,NA),
                     sec.axis = dup_axis(name = '',breaks = NULL,labels = NULL))+
  theme_half_open(12) +
  background_grid() +
  theme(
    strip.background = element_blank(),
    strip.text = element_textbox(
      size = 12,
      face = 'bold',
      color = "white", fill = "#5D729D", box.color = "#4A618C",
      halign = 0.5, linetype = 1, r = unit(5, "pt"), width = unit(1, "npc"),
      padding = margin(2, 0, 1, 0), margin = margin(3, 3, 3, 3)
    )
  )+
  theme(legend.position = 'top',
        axis.title = element_text(color='black',face='bold'),
        axis.text = element_text(color='black',face='bold'),
        legend.text = element_text(color='black',face='bold'),
        legend.title = element_text(color='black',face='bold'),
        panel.grid = element_blank(),
        legend.justification = 'center',
        plot.margin = unit(c(0,0,0,0), "cm"),
        plot.title = element_text(color='black',
                                  size=12,
                                  face='bold',hjust=0.5),
        plot.caption = element_text(face='bold'))
#Plot 2
G2 <- ggplot(df,aes(x=Var1,y=Var3))+
  geom_line(aes(color=Group,group=Group),size=1)+
  geom_point(aes(color=Group,group=Group,shape=Group),size=2)+
  scale_y_continuous(limits = c(0,NA),position = 'right')+
  theme_half_open(12) +
  background_grid() +
  theme(
    strip.background = element_blank(),
    strip.text = element_textbox(
      size = 12,
      face = 'bold',
      color = "white", fill = "#5D729D", box.color = "#4A618C",
      halign = 0.5, linetype = 1, r = unit(5, "pt"), width = unit(1, "npc"),
      padding = margin(2, 0, 1, 0), margin = margin(3, 3, 3, 3)
    )
  )+
  theme(legend.position = 'top',
        axis.title = element_text(color='black',face='bold'),
        axis.text = element_text(color='black',face='bold'),
        legend.text = element_text(color='black',face='bold'),
        legend.title = element_text(color='black',face='bold'),
        panel.grid = element_blank(),
        legend.justification = 'center',
        plot.margin = unit(c(0,0,0,0), "cm"),
        plot.title = element_text(color='black',
                                  size=12,
                                  face='bold',hjust=0.5),
        plot.caption = element_text(face='bold'))
#Merge plots
G3 <- G1+G2+plot_layout(guides = 'collect')&theme(legend.position = 'top')
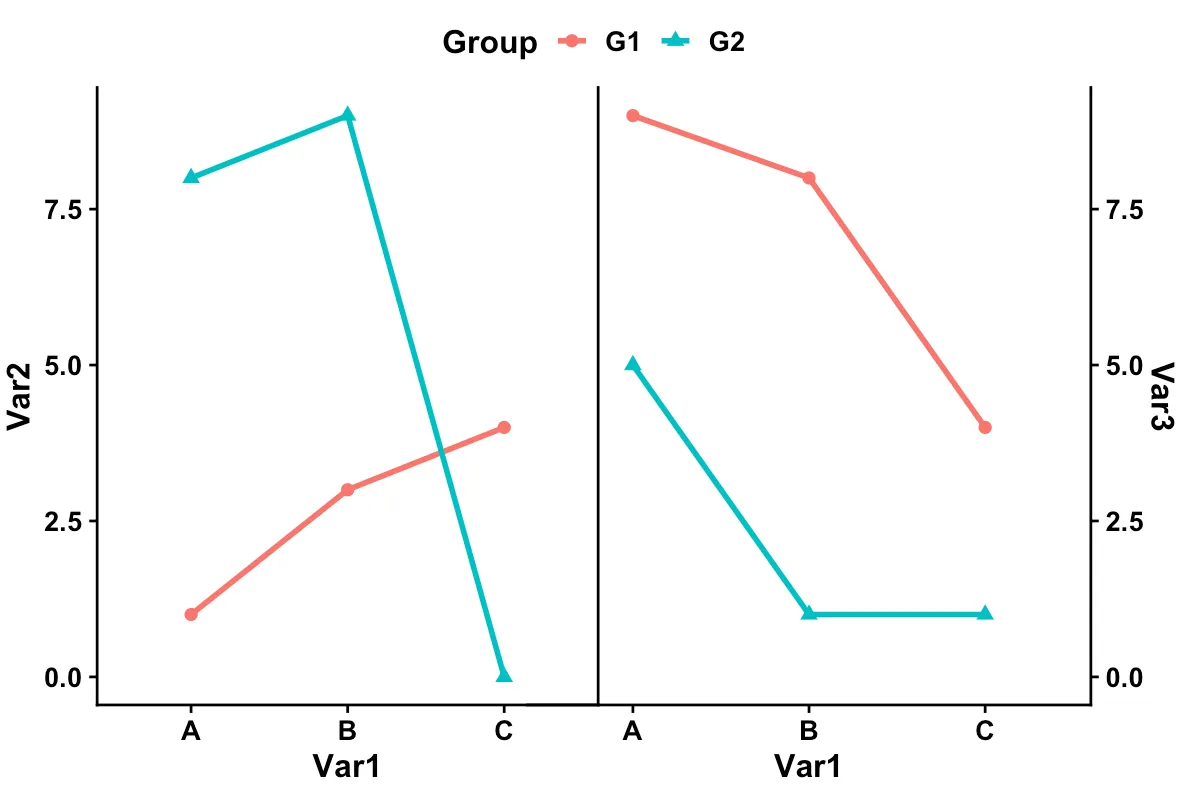
这是关于
G3 的结果:
df如下:#Data
df <- structure(list(Var1 = c("A", "B", "C", "A", "B", "C"), Group = c("G1",
"G1", "G1", "G2", "G2", "G2"), Var2 = c(1L, 3L, 4L, 8L, 9L, 0L
), Var3 = c(9L, 8L, 4L, 5L, 1L, 1L)), class = "data.frame", row.names = c(NA,
-6L))