我想获取scikit-learn中DecisionTreeClassifier的决策树(即规则集)从根节点到给定节点(由我提供)的决策路径。 clf.decision_path 指定样本经过的节点,这可能有助于获取样本遵循的规则集,但如何获取树中特定节点之前的规则集呢?
获取sklearn中一个节点的决策路径
10
- smian
3
2个回答
8
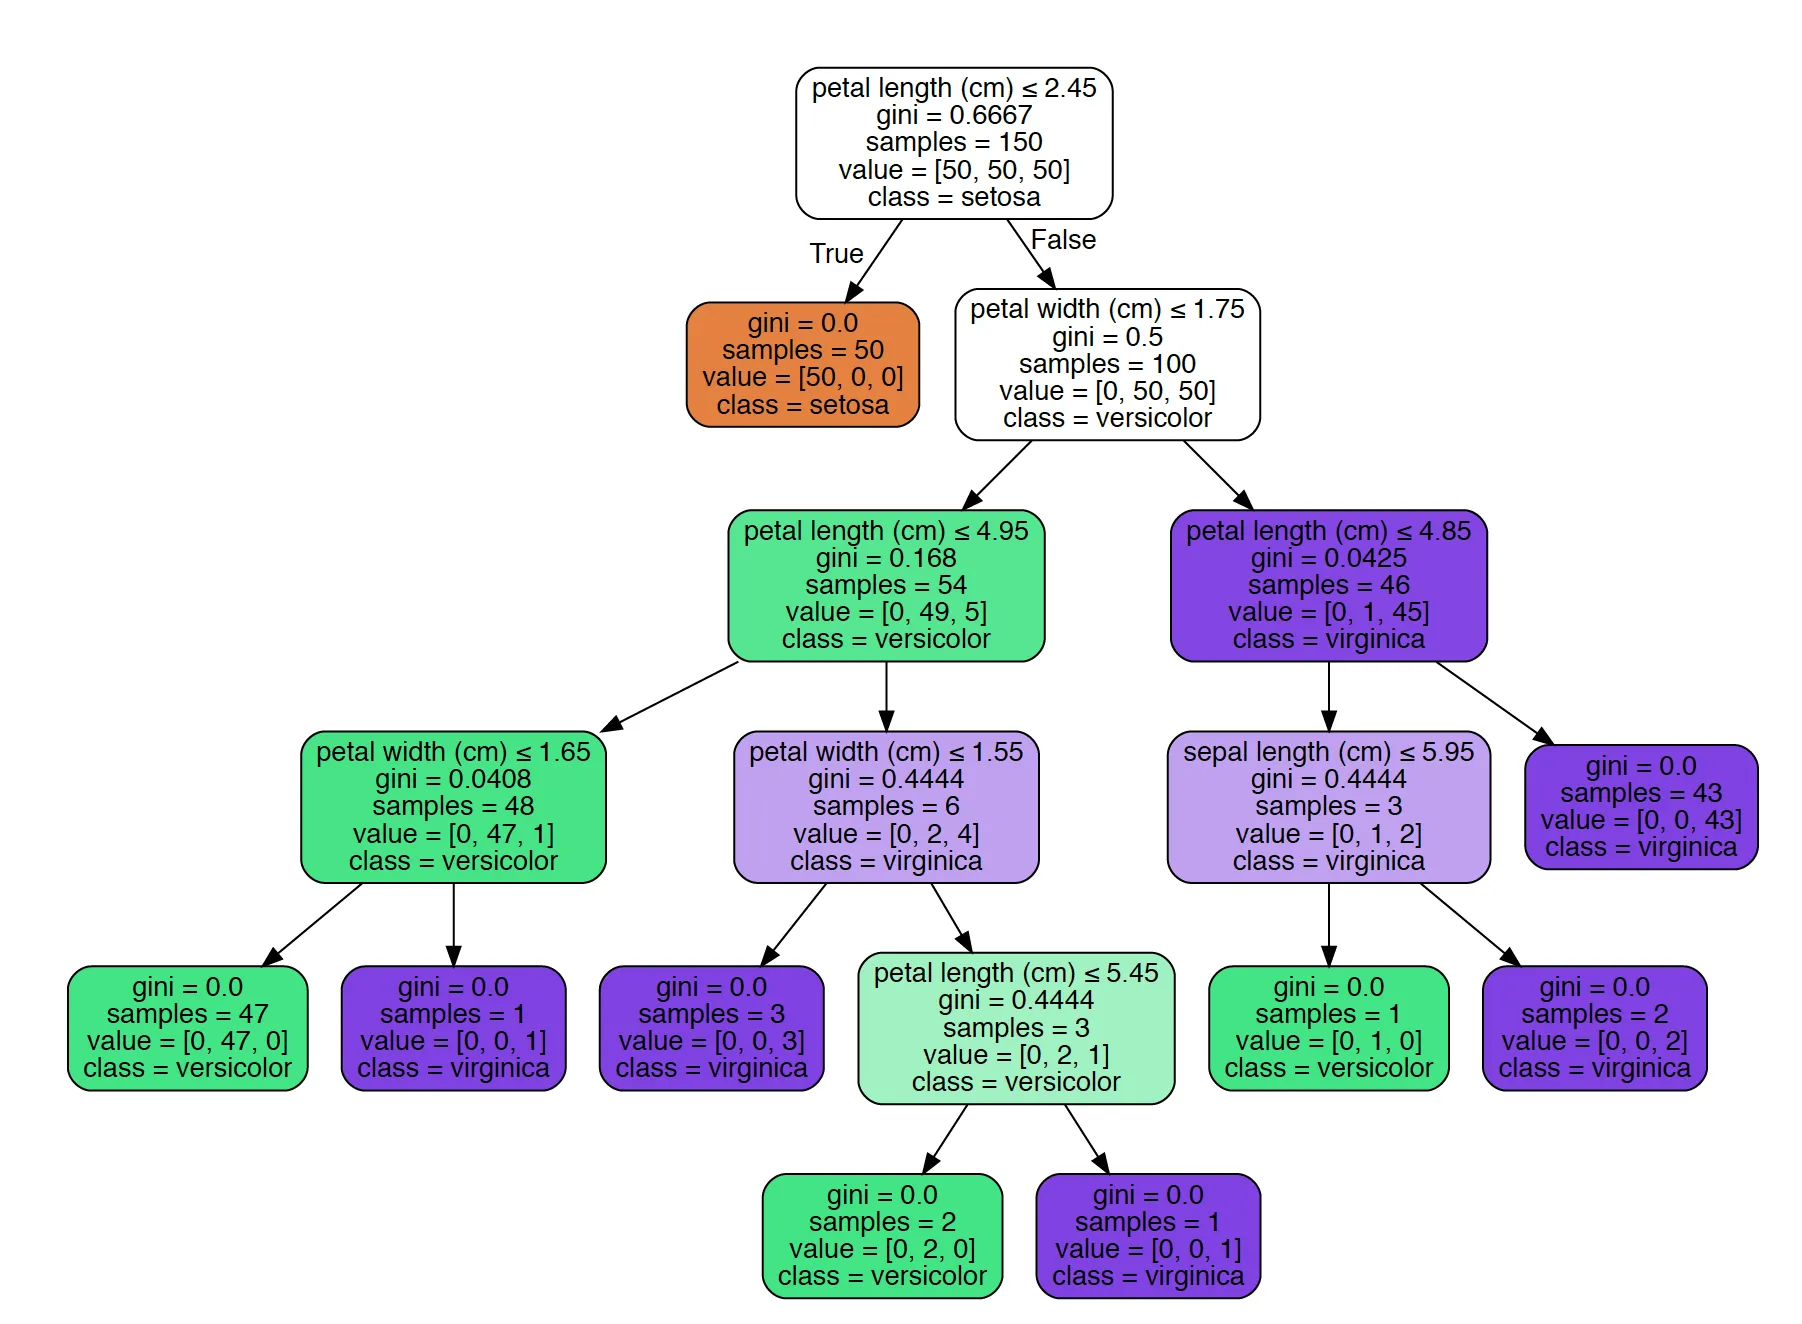
对于使用鸢尾花数据集的节点决策规则:
from sklearn.datasets import load_iris
from sklearn import tree
import graphviz

iris = load_iris()
clf = tree.DecisionTreeClassifier()
clf = clf.fit(iris.data, iris.target)

dot_data = tree.export_graphviz(clf, out_file=None,
                                feature_names=iris.feature_names,
                                class_names=iris.target_names,
                                filled=True, rounded=True,
                                special_characters=True)
graph = graphviz.Source(dot_data)
#this will create an iris.pdf file with the rule path
graph.render("iris")
对于基于样本的路径,请使用以下内容:
import numpy as np
from sklearn.model_selection import train_test_split
from sklearn.datasets import load_iris
from sklearn.tree import DecisionTreeClassifier

iris = load_iris()
X = iris.data
y = iris.target
X_train, X_test, y_train, y_test = train_test_split(X, y, random_state=0)

estimator = DecisionTreeClassifier(max_leaf_nodes=3, random_state=0)
estimator.fit(X_train, y_train)

# The decision estimator has an attribute called tree_  which stores the entire
# tree structure and allows access to low level attributes. The binary tree
# tree_ is represented as a number of parallel arrays. The i-th element of each
# array holds information about the node `i`. Node 0 is the tree's root. NOTE:
# Some of the arrays only apply to either leaves or split nodes, resp. In this
# case the values of nodes of the other type are arbitrary!
#
# Among those arrays, we have:
#   - left_child, id of the left child of the node
#   - right_child, id of the right child of the node
#   - feature, feature used for splitting the node
#   - threshold, threshold value at the node

n_nodes = estimator.tree_.node_count
children_left = estimator.tree_.children_left
children_right = estimator.tree_.children_right
feature = estimator.tree_.feature
threshold = estimator.tree_.threshold

# The tree structure can be traversed to compute various properties such
# as the depth of each node and whether or not it is a leaf.
node_depth = np.zeros(shape=n_nodes, dtype=np.int64)
is_leaves = np.zeros(shape=n_nodes, dtype=bool)
stack = [(0, -1)]  # seed is the root node id and its parent depth
while len(stack) > 0:
    node_id, parent_depth = stack.pop()
    node_depth[node_id] = parent_depth + 1

    # If we have a test node
    if (children_left[node_id] != children_right[node_id]):
        stack.append((children_left[node_id], parent_depth + 1))
        stack.append((children_right[node_id], parent_depth + 1))
    else:
        is_leaves[node_id] = True

print("The binary tree structure has %s nodes and has "
      "the following tree structure:"
      % n_nodes)
for i in range(n_nodes):
    if is_leaves[i]:
        print("%snode=%s leaf node." % (node_depth[i] * "\t", i))
    else:
        print("%snode=%s test node: go to node %s if X[:, %s] <= %s else to "
              "node %s."
              % (node_depth[i] * "\t",
                 i,
                 children_left[i],
                 feature[i],
                 threshold[i],
                 children_right[i],
                 ))
print()

# First let's retrieve the decision path of each sample. The decision_path
# method allows to retrieve the node indicator functions. A non zero element of
# indicator matrix at the position (i, j) indicates that the sample i goes
# through the node j.

node_indicator = estimator.decision_path(X_test)

# Similarly, we can also have the leaves ids reached by each sample.

leave_id = estimator.apply(X_test)

# Now, it's possible to get the tests that were used to predict a sample or
# a group of samples. First, let's make it for the sample.

# HERE IS WHAT YOU WANT
sample_id = 0
node_index = node_indicator.indices[node_indicator.indptr[sample_id]:
                                    node_indicator.indptr[sample_id + 1]]

print('Rules used to predict sample %s: ' % sample_id)
for node_id in node_index:

    if leave_id[sample_id] == node_id:  # <-- changed != to ==
        #continue # <-- comment out
        print("leaf node {} reached, no decision here".format(leave_id[sample_id])) # <--

    else: # < -- added else to iterate through decision nodes
        if (X_test[sample_id, feature[node_id]] <= threshold[node_id]):
            threshold_sign = "<="
        else:
            threshold_sign = ">"

        print("decision id node %s : (X[%s, %s] (= %s) %s %s)"
              % (node_id,
                 sample_id,
                 feature[node_id],
                 X_test[sample_id, feature[node_id]], # <-- changed i to sample_id
                 threshold_sign,
                 threshold[node_id]))
以下内容将会打印在结尾处:
用于预测样本0的规则:
决策编号节点0: (X [0, 3] (=2.4)> 0.800000011920929)
决策编号节点2: (X [0, 2] (=5.1)> 4.949999809265137)
到达叶子节点4,没有决策
- seralouk
2
1我从网站上看到了这个。我想要提取决策规则本身(就像你给出的第一个解决方案一样,但不是作为图像)。例如:如果我想要到达顶部第二层的绿色节点(其花瓣长度<=4.95),那么在给定该节点的节点ID的情况下,我想要得到:petal_length <= 2.45(False),petal_width <= 1.75(True),petal_length <= 4.95(即从根节点到该节点的规则组合)。我希望将此作为程序的输出,而不是graphviz图像(因为我得到的决策树非常大,查看graphviz输出对我没有帮助)。 - smian
我能获取测试样本的决策路径,而不是训练样本吗? - Alaa M.
2
如果您在
这里有你想要的内容。然后,您可以轻松编写一个程序来解析它并按照您的意愿进行处理。
export_graphviz中将out_file设为None,则可以获得树的字符串表示形式。from sklearn.datasets import load_iris
from sklearn import tree
clf = tree.DecisionTreeClassifier()
iris = load_iris()
clf = clf.fit(iris.data, iris.target)
string_data = tree.export_graphviz(clf,
out_file=None)
print(string_data)
#Output
digraph Tree {
node [shape=box] ;
0 [label="petal length (cm) <= 2.45\ngini = 0.667\nsamples = 150\nvalue = [50, 50, 50]\nclass = setosa"] ;
1 [label="gini = 0.0\nsamples = 50\nvalue = [50, 0, 0]\nclass = setosa"] ;
0 -> 1 [labeldistance=2.5, labelangle=45, headlabel="True"] ;
2 [label="petal width (cm) <= 1.75\ngini = 0.5\nsamples = 100\nvalue = [0, 50, 50]\nclass = versicolor"] ;
0 -> 2 [labeldistance=2.5, labelangle=-45, headlabel="False"] ;
3 [label="petal length (cm) <= 4.95\ngini = 0.168\nsamples = 54\nvalue = [0, 49, 5]\nclass = versicolor"] ;
2 -> 3 ;
4 [label="petal width (cm) <= 1.65\ngini = 0.041\nsamples = 48\nvalue = [0, 47, 1]\nclass = versicolor"] ;
3 -> 4 ;
5 [label="gini = 0.0\nsamples = 47\nvalue = [0, 47, 0]\nclass = versicolor"] ;
4 -> 5 ;
6 [label="gini = 0.0\nsamples = 1\nvalue = [0, 0, 1]\nclass = virginica"] ;
4 -> 6 ;
7 [label="petal width (cm) <= 1.55\ngini = 0.444\nsamples = 6\nvalue = [0, 2, 4]\nclass = virginica"] ;
3 -> 7 ;
8 [label="gini = 0.0\nsamples = 3\nvalue = [0, 0, 3]\nclass = virginica"] ;
7 -> 8 ;
9 [label="sepal length (cm) <= 6.95\ngini = 0.444\nsamples = 3\nvalue = [0, 2, 1]\nclass = versicolor"] ;
7 -> 9 ;
10 [label="gini = 0.0\nsamples = 2\nvalue = [0, 2, 0]\nclass = versicolor"] ;
9 -> 10 ;
11 [label="gini = 0.0\nsamples = 1\nvalue = [0, 0, 1]\nclass = virginica"] ;
9 -> 11 ;
12 [label="petal length (cm) <= 4.85\ngini = 0.043\nsamples = 46\nvalue = [0, 1, 45]\nclass = virginica"] ;
2 -> 12 ;
13 [label="sepal length (cm) <= 5.95\ngini = 0.444\nsamples = 3\nvalue = [0, 1, 2]\nclass = virginica"] ;
12 -> 13 ;
14 [label="gini = 0.0\nsamples = 1\nvalue = [0, 1, 0]\nclass = versicolor"] ;
13 -> 14 ;
15 [label="gini = 0.0\nsamples = 2\nvalue = [0, 0, 2]\nclass = virginica"] ;
13 -> 15 ;
16 [label="gini = 0.0\nsamples = 43\nvalue = [0, 0, 43]\nclass = virginica"] ;
12 -> 16 ;
}
这里有你想要的内容。然后,您可以轻松编写一个程序来解析它并按照您的意愿进行处理。
- Vivek Kumar
网页内容由stack overflow 提供, 点击上面的可以查看英文原文,
原文链接
原文链接
- 相关问题
- 8 为什么sklearn DecisionTreeClassifier的决策树结构只是二叉树?
- 9 在Python中获取二维数组中一个单元格的最短路径
- 10 SKLearn如何获取LinearSVC分类器的决策概率
- 6 Sklearn决策树中针对特定类别的决策规则
- 3 在检查决策路径时,使用sklearn RandomForest时出现特征和条件的重复。
- 10 如何在sklearn的Python中绘制SVM决策边界?
- 17 绘制scikit-learn(sklearn)SVM决策边界/面
- 4 SKLearn:获取每个点到决策边界的距离?
- 5 获取 Pandas.MultiIndex 中一个层级的位置
- 4 获取随机森林决策路径到叶节点的所有特征
clf.tree_.children_left和clf.tree_.children_right创建它。然后,您可以从每个叶子结点简单地遍历父数组。 - mallea