使用lattice和quantreg绘制多个分位数回归线

3
我希望能够绘制几条分位数回归线(quantreg包)如下所示:
 library(quantreg)
 data(engel)
 attach(engel)
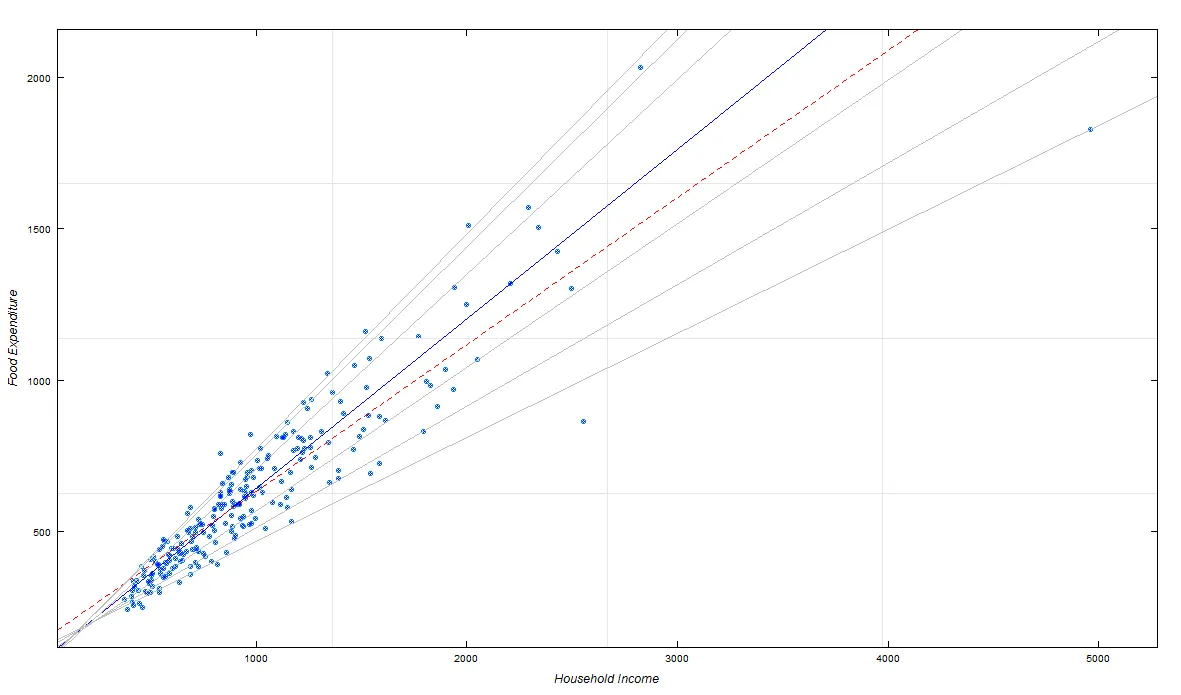
 plot(income, foodexp, cex = 0.25, type = "n",
      xlab = "Household Income", ylab = "Food Expenditure")
 points(income, foodexp, cex = 0.5, col = "blue")
 abline(rq(foodexp ~ income, tau = 0.5), col = "blue")
 abline(lm(foodexp ~ income), lty = 2, col = "red")
 taus <- c(0.05, 0.1, 0.25, 0.75, 0.9, 0.95)
 for (i in 1:length(taus)) {
   abline(rq(foodexp ~ income, tau = taus[i]),
          col = "gray")
 }
 detach(engel)

但是使用 lattice,我尝试了只用一个回归模型,但是没有成功:

require(lattice)
xyplot(foodexp~income , data =engel, 
   type = c("g"),
   auto.key=list(x=.8,y=.35,cex=.8,cex.title=.8, title="", points=TRUE), 
   scales=list(tck=-1),ylab=list("Food Expenditure",font=3),
   xlab=list("Household Income",font=3),
   panel=function(x,y){
     panel.xyplot(x,y)
     panel.grid()
     panel.abline(rq(foodexp ~ income, tau = 0.5))}
)
1个回答

4

使用 lattice 库时,只需要在面板函数中使用 yx

enter image description here

xyplot(foodexp~income , data =engel, 
       type = c("g"),
       auto.key=list(x=.8,y=.35,cex=.8,cex.title=.8, title="", points=TRUE), 
       scales=list(tck=-1),ylab=list("Food Expenditure",font=3),
       xlab=list("Household Income",font=3),
       panel=function(x,y,...){
         panel.xyplot(x,y)
         panel.grid()
         panel.abline(rq(y ~ x, tau = 0.5))
         panel.points(x, y, cex = 0.5, col = "blue")
         panel.abline(rq(y ~ x, tau = 0.5), col = "blue")
         panel.abline(lm(y ~ x), lty = 2, col = "red")
         taus <- c(0.05, 0.1, 0.25, 0.75, 0.9, 0.95)
         for (i in 1:length(taus)) {
           panel.abline(rq(y ~ x, tau = taus[i]),
                  col = "gray")
         }

       }
)

网页内容由stack overflow 提供, 点击上面的
可以查看英文原文,
原文链接